T. Galbo, 1,4 I.L. Pedersen, 2,4 T. Fløyel, 3 C.H. Bang-Berthelsen, 3 P. Serup, 1,4 O.D. Madsen, 1,4 J. Hald 1,4
1Hagedorn Research Institute, Department of Beta-cell Regeneration, Gentofte, Denmark; 2Novo Nordisk A/S, Department of Antibody Technology, Måløv, Denmark; 3Hagedorn Research Institute, Department of Diabetes Genome Biology, Gentofte, Denmark; 4Antibody Core, Beta Cell Biology Consortium, www.betacell.org
Correspondence: Jacob Hald, Hagedorn Research Institute, Niels Steensensvej 6, DK-2820 Gentofte, Denmark.
Tel: +45.4443.9185 - Fax: +45.4443.8000 E-mail: hald@hagedorn.dk
Key words: Pdx1, pancreas, diabetes, antibody, FACS, INSrαβ-Pdx1, Dox.
Contribution: all authors on this paper have been involved in substantial contributions to conception and design, acquisition of data, or analysis and interpretation of data; drafting the article or revising it critically for important intellectual content; final approval of the version to be published.
Acknowledgements: this work was supported by the NIDDK; 1U19DK 61244-4, 5U19 DK-42502-15 and 1U01 DK-72473 (Antibody Core; ODM.), DK072495 (to PS); the Danish Diabetes Association (to CHBB); and by the EU 6th Framework Programme (to ODM). We thank Bernard Peers for providing the GST-Pdx1 expression plasmid, Chris Wright for providing the polyclonal goat anti-Pdx1 antibody, and Anette Bjerregaard, Hanne Duus, Anne M. Ejrnæs Sprinkel, Maria Lauritzen and Camilla Schwartz for advice and expert technical assistance.
©Copyright T. Galbo et al., 2010
Licensee PAGEPress, Italy
European Journal of Histochemistry 2010; 54:e19
doi:10.4081/ejh.2010.e19
AbstractThe aim of this study was to characterize two monoclonal antibodies (F6A11 and F109-D12) generated against Pdx1 (pancreatic and duodenal homeobox-1), a homeodomain transcription factor, which is critical for pancreas formation as well as for normal pancreatic beta cell function. For production of monoclonal antibodies, we immunized Robertsonian POSF (RBF)mice with a GST-Pdx1 fusion protein containing a 68-amino acid C-terminal fragment of rat Pdx1. These monoclonal antibodies detect Pdx1 by western blotting and allow immunohistochemical detection of Pdx1 in both mouse and rat tissue. F6A11 and F109-D12 produce IHC staining patterns indistinguishable from that obtained with highly specific polyclonal Pdx1 antisera raised in rabbits and goats, when applied to embryonic or adult mouse pancreatic tissue. In contrast to previously generated polyclonal anti-Pdx1 antisera, we also demonstrate that F6A11 works for intracellular fluorescence activated cell sorting (FACS) staining of Pdx1. By using F6A11, we characterize the induction of Pdx1 in the Doxycycline (DOX) inducible insulinoma cell line INSrαβ-Pdx1 and follow the reduction of Pdx1 after removing Dox. Finally, we show that induction of exogenous Pdx1 leads to a reduction in endogenous Pdx1 levels, which suggests that a negative feedback loop is involved in maintaining correct levels of Pdx1 in the cell.
|
The pancreatic duodenal homeobox gene 1, Pdx1, encodes a key regulatory factor required for pancreatic development in mouse1,2 and man,3 as well as for normal β-cell function including glucose-regulated insulin production.4,5 In the adult pancreas, high levels of Pdx1 expression are primarily restricted to insulin producing β-cells, and the protein was first identified and characterized as an insulin gene trans-activating factor.6,7 In the mature β-cell, Pdx1 is involved in glucose regulated insulin gene transcription8 and mutations in PDX1 cause maturity onset diabetes of the young (MODY).9
Pdx1 expression begins at embryonic day 8.5 (e8.5) in two ventro-lateral domains, before closure of the foregut endoderm. Slightly later (~e8.75) a dorsal expression domain appears at the level of somites 4 to 7. Until around e9.5, Pdx1 expression is restricted to the pancreatic buds, but from around e10.5 the Pdx1-expression domain expands to include the duodenum, the pyloric region and the antral stomach.
From e13.5-15.5, Pdx1 expression levels decline in the forming acinar cells, while remaining more broadly expressed throughout the developing ductal tree, where high-level Pdx1- and Nkx6.1-expression marks the forming β-cells.2,7,10,11 As the islets begin to form around e18.5, expression of Pdx1 becomes localized primarily to the β-cells.
Selective inactivation of Pdx1 expression in β-cells leads to loss of these and to diabetes.4,12 Furthermore, timed inactivation of Pdx1 expression during mouse pancreas development demonstrates Pdx1-requirement also for normal acinar development and maintenance of the exocrine transcription factor Ptf1a.5 Additionally, several target genes have been identified for Pdx1, including the insulin gene,8 Nkx6.1,13 GLUT-2,14 IAPP,15,16 glucokinase14,16 as well as somatostatin,17,18 exocrine genes such as Elastase119 and finally also Pdx1 itself.20,21
The rat a/β-cell hybrid subclone INSrαβ-Pdx1 has been generated with the aim to further study Pdx1 regulated genes and the role of Pdx1 in β-cell maturation. In this cell line Pdx1 levels are under the control of the reverse tetracycline-dependent transactivator (rtTA).22 This INSrαβ-Pdx1 cell line has been used to identify genes with potential functional significance in type 1 diabetes (T1D),23,24 to study insulin processing and secretion25,26 and to elucidate the role of Pdx-1 in β-cell maturation and acquired IL-1β-mediated toxicity.24 However, the details of the dynamic induction of Pdx1 in this important model system are not known, as well as the effects of expressing high levels of exogenous Pdx1 protein on the endogenous Pdx1 protein levels. By help of a more detailed biological understanding of the system, more conclusive data may be drawn from such experiments. We used newly generated monoclonal antibodies against Pdx1 to study the induction of Pdx1 in the INSrαβ-Pdx1 cell line and show that induction of exogenous Pdx1 leads to a reduction in endogenous Pdx1 levels. This suggests that a negative feedback loop is involved in maintaining correct levels of Pdx1 in the cell.
Expression and purification of GST-Pdx1
For immunizations, we cloned a 68 amino acid C-terminal fragment of the rat Pdx1 transcription factor (aa215-283) as a GST fusion protein.27 The C termini of the rat, mouse and human Pdx1 proteins vary in sequence; the chosen GST-Pdx1 fusion protein have previously allowed us to generate polyclonal antisera that may be either rat-specific or cross-react to mouse and/or human Pdx1.15,28,29 The GST-Pdx1 fusion protein was purified using a Glutathione Sepharose 4B Redipack column (Amersham Biosciences, Uppsala, Sweden).
In order to obtain monoclonal antibodies, four RBF-mice30 were immunized i.p. with 20 μg GST-Pdx1 biweekly. The first immunization was performed with complete Freund’s adjuvant; this was followed by two injections in incomplete Freund’s adjuvant. Ten days after the third immunization, the animals were eye-bled and the antibody response measured by ELISA. In addition, specific staining of β-cells of adult mice pancreatic tissue was determined by immunohistochemical staining. All animal experiments were performed according to national guidelines and approved by the national ethics committee.
The mouse selected for generation of monoclonal antibodies was boosted i.v. with 10 μg antigen in saline. Three days later, the spleen was harvested and used for hybridoma production. The 1.3¥108 spleen cells were fused to 3.9¥107 FOX-NY myeloma cells30 using polyethyleneglycol (PEG) 1500 (Roche, Hvidovre, Denmark) as described in a previous study.31 The fused cells were initially seeded in 96 well tissue culture plates and the individual clones tested for the production of anti-Pdx1 antibodies, by ELISA and immunohistochemical staining. Positive clones were subcloned by limiting dilution.
ELISA plates were coated O/N with 1 μg/mL GST-Pdx1 or pure GST (Sigma, Brøndby, Denmark) in PBS. Washing and blocking was performed with PBS, 0.05% Tween 20. Then, samples were added, after dilution in PBS, 0.5% Tween 20, 1 M NaCl, pH 7.2 and the plates incubated for 1 hr at room temperature (RT). The presence of antigen specific antibodies was detected with horse radish peroxidase (HRP) conjugated goat anti-mouse IgG (Caltag, Hamburg, Germany) diluted 1:2000. 100 μLof 3,3´,5,5´-tetramethylbenzidine (TMB) (Kem-En-Tec, Copenhagen, Denmark) was added to each well and the reaction was terminated with 100 μL 4 M H3PO4. The absorbance of the ELISA plates was read at 450 and 620 nm.
The isotypes of the antibodies were determined using the Mouse Monoclonal Antibody Isotyping Kit (Boehringer Mannheim, Hvidovre, Denmark), according to the manufacturer’s instructions. The antibodies were purified from culture supernatant using a protein A Sepharose 4 Fast Flow column (Amersham Biosciences, Uppsala, Sweden). The pH of the filtered supernatants was adjusted to 8.5 and the solutions supplemented with 3 M NaCl. The samples were applied to the column, initially equilibrated and subsequently washed with 50 mM Tris, 3.5 M NaCl, pH 8.5. Elution was performed with 25 mM Citric acid, 4.5 mM Tri-natrium-citrate and pH 3. The pooled eluates were dialyzed against phosphate buffered saline (PBS) and 0.05% NaN3 was added to the purified antibodies.
In general, animal sera, hybridoma supernatants and purified antibodies against Pdx1 were analysed by immunohistochemical staining on frozen sections of adult murine pancreas. Tissue was fixed in 4% PFA O/N, cryo-protected by O/N incubation in 30% sucrose and finally embedded in Tissue-Tek. Ten µm sections were cut and stored at -80°C. For antigen retrieval, the sections were soaked in 200 mL 0.01M Citrate buffer and microwaved for 4 min at 600W, followed by 15 min at 250W and finally left cooling for 20 min. The tissue sections were rinsed in PBS, treated with 3% H2O2 for 5 min and rinsed again. TNB blocking buffer was added and the sections blocked for 30 min, before O/N incubation with the mouse anti-Pdx1 antibodies at a concentration of 0.5 µg/mL, diluted 1:5000 in TNB blocking buffer. For absorption studies, the anti-Pdx1 antibodies were pre-incubated with GST-Pdx1 or the GST-Nkx6.1 before use, as described by previous studies.28,32 The sections were washed 3¥5 min in PBS between the incubations with primary antibody and the following incubations with biotinylated secondary anti mouse antibody (Zymed) for 30 minutes and streptavidin-peroxidase conjugate (Zymed) for 15 minutes. The bound antibodies were visualized with the Cy3 fluorophore tyramide signal amplification (TSA) agent (PerkinElmer) diluted 1:100, after a 10 min incubation period and a subsequent wash in PBS. Double staining with antisera raised against Pdx1 in different species was performed with relevant mouse anti-Pdx1 clone and rabbit anti-Pdx1 1858.5, 1:800.29 Triple staining experiments were performed by first adding Pdx1 antibody and developing it with Cy3- TSA, then incubating with guineapig-anti-insulin 1:100 (Abcam, ab7842) and rabbit anti glucagon 1:300 (DAKO, A0565), visualized by donkey anti guineapig-Cy2 and donkey anti rabbit-Cy5 (Jackson Immunoresearch). Whole mount stains were done as described by Ahnfelt-Ronne J et al.33 Mouse anti-Pdx1 (F6) 1:700, guineapig anti-glucagon 1:4000, goat anti-Pdx1 1:15000 (kind gift from Chris Wright) and developed with donkey anti rabbit-Cy3, donkey anti-guinea pig-Cy2 and donkey anti-goat-Cy5. Images were collected with on a Zeiss LSM 510 META confocal microscope.
The SV40 large T-antigen transformed βTC6 insulinoma cells34 and αTC1.935 were grown in DMEM (glucose 1g/L) supplemented with 1% glutamax 5% FCS, 20 mM Hepes, 10 µM 2-mercaptoethanol and 1% glutamax, 10 % FCS, respectively. Nuclear extracts from the cells were generated from cells harvested by trypsination. Cell pellets were lysed in 1 mL lysis buffer (10 mM Hepes pH 7.9, 10 mM KCL, 0.1 mM EDTA and 0,1% Nonidet P40 [NP40], supplemented with the protease inhibitor cocktail containing 1 mM AEBSF, 1 mM DTT, 10 µg/mL Aprotinin, 10 µg/mL Leupeptin and 1 µg/mL Pepstatin A). The cell extract was vortexed and incubated on ice for 45 min. After centrifugation, the pellet was re-suspended in 20 mM Hepes pH 7.9, 0.4M NaCl and 1 mM EDTA supplemented with protease inhibitor cocktail. After five min incubation on ice, the extract was centrifuged and the protein concentration of the supernatant was measured by the Bradford method (Bio-Rad Laboratories, Herlev, Denmark).
Purified GST-Pdx1 fusion protein or 10 µg of nuclear extract was heated for 10 min at 70°C in sample buffer and loaded onto NuPAGE SDS PAGE gels, run alongside the MagicMark XP Standard (Invitrogen, Taastrup, Denmark). The proteins were blotted onto a nitrocellulose membrane using the NuPAGE 4-morpholinepropanesulfonic acid (MOPS) buffer system. The membrane was washed in PBS 0.1%Tween and blocked for 1 hr at RT in Amersham Membrane blocking agent NIF833. 5% w/v in PBS 0.1% Tween. The monoclonal anti-Pdx1 antibodies were diluted to a concentration of 1 μg/mL before O/N incubation with the membrane at 4°C. A HRP-conjugated rabbit Anti-Mouse IgG (DakoCytomation, Glostrup, Denmark) was used as the secondary antibody at a dilution of 1:5000, for 1 hr at RT. Chemiluminescence was detected using the ECL analysis system (Amersham Biosciences, Uppsala, Sweden) and developed with a LAS 3000 from FUJI FILM.
INSrαβ-Pdx122 cells, passage 38-42, were stimulated for 24 hours in medium (RPMI 1640 supplied with 10% Fetal Bovine Serum (Gibco), 1% Penicillin/Streptomycin (Gibco) and 50 μM β-mercaptoethanol (Sigma) with 500 ng/mL doxycycline (Dox) (Sigma). Cells were rinsed for 5 min in PBS w/o Ca2+/Mg2+ and for one hour in fresh medium without Dox. The cells were then given fresh medium without Dox. Cells were harvested 0, 4, 24, 28, 32, 48, 60 and 72 hours after stimulation with 0.05% Trypsin-EDTA (Gibco) and fixated for 20 minutes in 4% paraformaldehyde (Lilly’s fixative) (VWR International).
For each time point, 106 fixed cells were permeabilised by 0.03% Triton X-100 (Sigma) in PBS w/o Ca2+/Mg2+ supplemented with 0.1% Bovine Serum Albumin (BSA) (Sigma) for one hour. In order to block unspecific binding, 10% donkey serum (Jackson) was added for additionally one hour. Cells were then incubated overnight with mouse monoclonal anti-Pdx1 antibody (F6A11) diluted to a final concentration of 5.00 μg/mL, or mouse IgG1k (Abcam) diluted to a final concentration of 5.00 μg/mL. Rabbit anti-Pdx1 serum (1858.5) or non-immune rabbit serum were tested at dilutions of 1:1000 and 1:5000. The cells were washed three times in PBS + 0.1% BSA, then incubated with a Cy2 conjugated donkey anti-mouse antibody or a Cy2 conjugated donkey anti-rabbit antibody (both Jackson ImmunoResearch) diluted 1:300, for one hour. Cells were then washed three times in PBS + 0.1% BSA and analyzed on a FACS Aria flow cytometer (Beckton-Dickinson). Data analysis was performed using FCS Express Version 3 (De Novo Software).
After stimulation with Dox, total RNA was extracted from the INSrαβ-Pdx1 cells and cDNA was prepared using reverse transcription, as described by the manufacturer (TaqMan RT reagents, Applied Biosystems, Foster City, CA, USA). The expression levels of the genes were analysed by use of TaqMan assays (Assay ID: Rat Pdx1 Rn00755591_m1, Mouse Pdx1 Mm00435565_m1, Rat Ppia Rn00690933_m1, Applied Biosystems) and samples were run on a TaqMan 7900HT system (Applied Biosystems). The expression level of the gene of interest was normalised against the expression of the housekeeping gene peptidylprolyl isomerase A (Ppia) and evaluated using the delta-delta Ct method.36
All immunofluorescence images were recorded on a LSM510 confocal microscope (Carl Zeiss; Brock & Michelsen, Birkerød, Denmark). Image manipulations were performed using linear adjustments over the entire image in LSM Zeiss viewer and Adobe Photoshop.
A detailed understanding of the dynamic changes in Pdx1 levels in the INSrαβ-Pdx1 cell line after induction of Pdx1 is vital to data interpretation from this system. To characterize it, we induced INSrαβ-Pdx1 with Dox for 24 hours, washed the Dox out and followed the cells for further 48 hours. To obtain a quantitative measure of Pdx1 levels in the INSrαβ-Pdx1 cell line, we assayed Pdx1 levels by FACS on permeabilized cells. Using the validated 1858.5 rabbit anti-Pdx1 antiserum,29 we were unable to detect a shift in fluorescence after 24 hours of Dox induction. However, using the 1858.5 rabbit anti-Pdx1 antiserum on INSrαβ-Pdx1 cells in immunocytochemistry (ICC) did result in clear nuclear Pdx1 staining (data not shown). This is likely due to the use of antiserum instead of the monoclonal antibodies that are usually utilized in FACS experiments with success. However, since no good monoclonal antiPdx1 antibody was available, we set out to generate one.
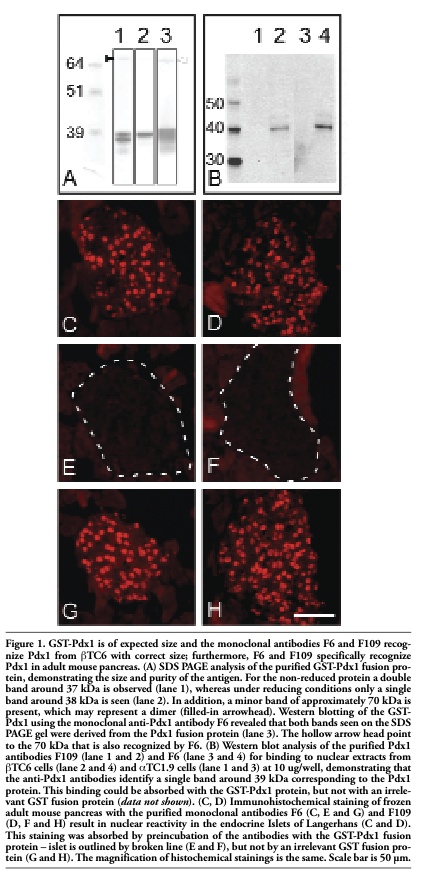
Monoclonal antibodies against the Pdx1 transcription factor were generated by immunising RBF mice with a GST-Pdx1 fusion protein, containing the 68 amino acids of the C-terminal fragment of rat Pdx1 protein (aa 215-283). We have previously used this fusion-construct(27) to generate a series of high-titered rabbit antisera, some of which showed cross-reaction to both mouse and human Pdx1.15,28,29 The expected size of the GST-Pdx1 fusion protein is ~37 kDa. The purified protein is observed as a double band around 37 kDa (Figure 1A, lane 1), which however could be reduced to a single band of approximately the expected molecular weight (Figure 1A, lane 2). In addition, a band of ~70 kDa was observed (Figure 1A, lane 1 filled-in arrow head). This larger band may represent a dimer, as another anti-Pdx1 antibody, when analyzed by western blotting (Figure 1A, lane 3 hollow arrow head), also recognized it.
Three out of four mice responded to immunization with antibody titters higher than 1:36.450, as determined by binding to the GST-Pdx1 fusion protein in direct ELISA. However, only one of the sera stained a sub-population of cells on sections of adult mouse pancreas at a dilution of 1:100, corresponding to the β-cell population. Thus, this mouse was selected as the best starting material for hybridoma generation, to develop monoclonal antibodies against Pdx1 that could be used primarily for FACS but also for other immuno-techniques.
The resulting hybridomas were screened for the selective binding to Pdx1, by binding to the rat GST-Pdx1 fusion protein vs GST in direct ELISA. Subsequently, the 74 most positive clones were further screened for staining of PFA fixed, frozen sections of adult mouse pancreas, by immunohistochemstry. Five hybridomas produced very strong signals, whereas further four gave weaker signals. Additional subcloning of the cells resulted in two stable hybridomas producing high affinity mouse monoclonal antibodies against Pdx1, termed F6A11 and F109-D12 (hereafter: F6 and F109). These two hybridomas were produced in large scale and the antibodies purified from the cell culture supernatant using protein A. The antibodies produced by both the F6 and F109 hybridomas were determined to be of the IgG1/κ subtype (data not shown).
Both the monoclonal anti-Pdx1 antibodies F6 and F109 were shown to recognize the GST-Pdx1 antigen by western blotting (Figure 1A, lane 3, and data not shown). In addition, the antibodies stained a band of 39 kDa, corresponding to the Pdx1 protein, in nuclear extracts from the SV40 large T-antigen transformed mouse insulinoma βTC6 cell line (Figure 1B, lane 2 and 4), but not from the αTC1.9 glucagonoma mouse cell line (Figure 1B, lane 1 and 3). This again reflects the expected expression of Pdx1 in these two islet tumor lines. This Western-blot staining specificity of F6 and F109 was confirmed by pre-absorption studies, where only pre-incubation with GST-Pdx1 fusion protein and not GST-Nkx6.1 was able to abolish the appearance of the 39 kDa band (data not shown).
The purified monoclonal mouse anti-Pdx1 antibodies F6 and F109 were further characterized by staining of frozen sections of adult mouse pancreas and fetal pancreas. Both antibodies were demonstrated to specifically stain the nuclei of a sub-population of cells in the endocrine islets of Langerhans, as expected for a Pdx1 reactive antibody (Figure 1, C and D). Specificity was demonstrated as the staining of the cell nuclei was eliminated by pre-absorption of the antibodies with the GST-Pdx1 fusion protein (Figure 1, E and F), but not by pre-absorption with an irrelevant GST fusion protein (Figure 1, G and H). Furthermore, double staining of adult pancreas with a rabbit anti-Pdx1 antiserum (1858.5)29 demonstrated a near complete overlap of the nuclei recognized by the two antibodies (Figure 2A-C and D-F). On close inspection of the co-stain (Figure 2 A-F) and other data (not shown), we found that the F6 monoclonal antibody was superior regarding: i) less background and more consistent performance in IHC and ii) an apparent better growth-rate of the hybridoma. We thus went on to further characterize this antibody and performed triple staining of mouse e10.5 tissue with F6, goat anti-Pdx1 and guinea-pig anti-glucagon. This again confirmed that F6 and goat anti-Pdx1 stain in overlapping patterns (Figure 2G-I). However, the goat serum appears to give a stronger signal in the duodenum and stomach (Figure 2G-I). Co-staining of adult mouse pancreas for Pdx1, insulin and glucagon, clearly demonstrated the expected b-cell specific staining pattern, as insulin positive cells are positive for Pdx1 immunoreactivity (Figure 2J-I), while glucagon positive cells are not (blue) (Figure 2L). The antibodies were also shown to react with rat Pdx1, but they did not recognize Pdx1 from human tissue (data not shown). Furthermore, the antibodies worked equally well on frozen/fixed or paraffin sections as well as by using Lilly’s fixative (data not shown). Finally, the antibodies were efficient when used in a standard indirect immunofluorescence experiments; i.e. without the use of TSA amplification (data not shown).
Having generated and validated monoclonal antibodies to Pdx1, we then wanted to test if they were useful for assaying Pdx1 protein levels in individual cells by intracellular FACS analysis. To this end, INSrαβ-Pdx1 cells were induced with Dox for 24 hours and Pdx1 levels were analysed at 0 hours, 4 hours and 24 hours by FACS. The Dox was then washed out and, the cells were followed for additionally 48 hours and tested in FACS at 4, 8, 24, 36 and 48 hours post-wash. A fast and significant rise in mean fluorescence intensity was observed already after 4 hours, reaching a 2.3-fold increase compared with control levels at 24 hours (Figure 3A and G). Increase in Pdx1 levels was confirmed by western blotting (data not shown). Pdx1 levels declined significantly already 8 hours after removal of Dox and a further reduction was observed 24 hours after Dox removal. At this time, the Pdx1 level had been reduced 3.4-fold compared with the maximum levels 24 hours after addition of Dox. Surprisingly, Pdx1 levels were reduced significantly below starting levels 24 hours after removal of Dox. However, the reduction in Pdx1 levels observed at 24 after Dox removal was normalized after additional 24 hours (Figure 3G). In order to confirm that the fluorescence-signal observed by FACS reflected an immunoreaction to Pdx1, we investigated the staining in the microscope and found a convincing nuclear staining at 24 hours after induction with Dox (Figure 3E). Furthermore, the strong induction of Pdx1 was confirmed by comparing the immunoreaction before and after induction (Figure 3D vs. D). The observed decline in Pdx1 levels at 24 hours was confirmed by fluorescence microscopy when comparing this time point with cells before induction (Figure 3D vs. F).
To investigate whether the observed reduction in Pdx1 levels 24 hours after Dox removal (Figure 3F and G) might reflect a reduction in the synthesis of endogenous rat Pdx1, we performed qPCR for mouse (induced) and rat (endogenous) Pdx1 mRNA at 24 hours after induction, the time point where total Pdx1 protein level peaks. This analysis showed that mouse Pdx1 mRNA was up-regulated 28-fold (Figure 4, black). In contrast, rat Pdx1 mRNA was reduced by 3 fold (Figure 3F, grey). To rule out a general reduction of all endogenous genes upon induction with Dox, qPCR was performed for several other mRNAs. The other profiled genes did not show any significant differential regulation (data not shown).
|
Figure 1. GST-Pdx1 is of expected size and the monoclonal antibodies F6 and F109 recognize Pdx1 from bTC6 with correct size; furthermore, F6 and F109 specifically recognize Pdx1 in adult mouse pancreas. (A) SDS PAGE analysis of the purified GST-Pdx1 fusion protein, demonstrating the size and purity of the antigen. For the non-reduced protein a double band around 37 kDa is observed (lane 1), whereas under reducing conditions only a single band around 38 kDa is seen (lane 2). In addition, a minor band of approximately 70 kDa is present, which may represent a dimer (filled-in arrowhead). Western blotting of the GST-Pdx1 using the monoclonal anti-Pdx1 antibody F6 revealed that both bands seen on the SDS PAGE gel were derived from the Pdx1 fusion protein (lane 3). The hollow arrow head point to the 70 kDa that is also recognized by F6. (B) Western blot analysis of the purified Pdx1 antibodies F109 (lane 1 and 2) and F6 (lane 3 and 4) for binding to nuclear extracts from bTC6 cells (lane 2 and 4) and aTC1.9 cells (lane 1 and 3) at 10 ug/well, demonstrating that the anti-Pdx1 antibodies identify a single band around 39 kDa corresponding to the Pdx1 protein. This binding could be absorbed with the GST-Pdx1 protein, but not with an irrelevant GST fusion protein (data not shown). (C, D) Immunohistochemical staining of frozen adult mouse pancreas with the purified monoclonal antibodies F6 (C, E and G) and F109 (D, F and H) result in nuclear reactivity in the endocrine Islets of Langerhans (C and D). This staining was absorbed by preincubation of the antibodies with the GST-Pdx1 fusion protein – islet is outlined by broken line (E and F), but not by an irrelevant GST fusion protein (G and H). The magnification of histochemical stainings is the same. Scale bar is 50 µm. |
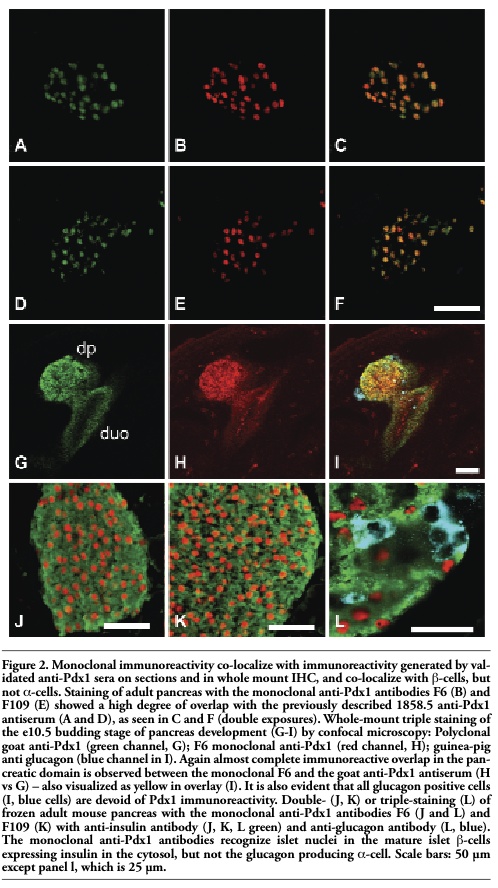 |
Figure 2. Monoclonal immunoreactivity co-localize with immunoreactivity generated by validated anti-Pdx1 sera on sections and in whole mount IHC, and co-localize with b-cells, but not α-cells. Staining of adult pancreas with the monoclonal anti-Pdx1 antibodies F6 (B) and F109 (E) showed a high degree of overlap with the previously described 1858.5 anti-Pdx1 antiserum (A and D), as seen in C and F (double exposures). Whole-mount triple staining of the e10.5 budding stage of pancreas development (G-I) by confocal microscopy: Polyclonal goat anti-Pdx1 (green channel, G); F6 monoclonal anti-Pdx1 (red channel, H); guinea-pig anti glucagon (blue channel in I). Again almost complete immunoreactive overlap in the pancreatic domain is observed between the monoclonal F6 and the goat anti-Pdx1 antiserum (H vs G) – also visualized as yellow in overlay (I). It is also evident that all glucagon positive cells (I, blue cells) are devoid of Pdx1 immunoreactivity. Double- (J, K) or triple-staining (L) of frozen adult mouse pancreas with the monoclonal anti-Pdx1 antibodies F6 (J and L) and F109 (K) with anti-insulin antibody (J, K, L green) and anti-glucagon antibody (L, blue). The monoclonal anti-Pdx1 antibodies recognize islet nuclei in the mature islet b-cells expressing insulin in the cytosol, but not the glucagon producing a-cell. Scale bars: 50 µm except panel l, which is 25 µm. |
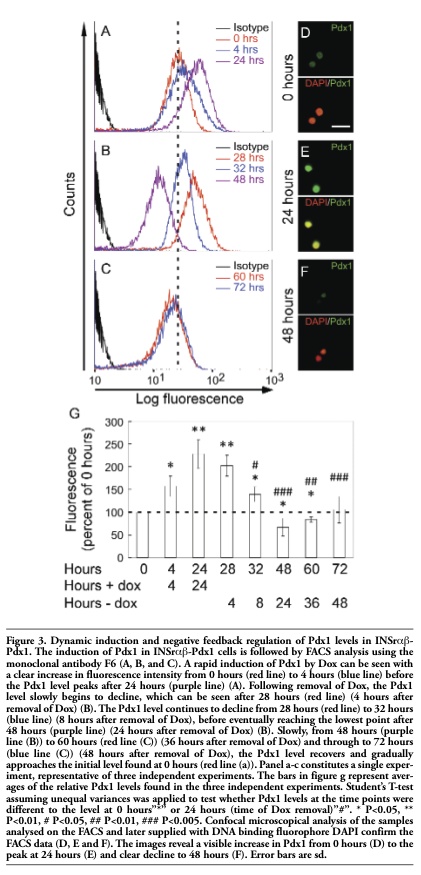 |
Figure 3. Dynamic induction and negative feedback regulation of Pdx1 levels in INSrαβ-Pdx1. The induction of Pdx1 in INSrαβ-Pdx1 cells is followed by FACS analysis using the monoclonal antibody F6 (A, B, and C). A rapid induction of Pdx1 by Dox can be seen with a clear increase in fluorescence intensity from 0 hours (red line) to 4 hours (blue line) before the Pdx1 level peaks after 24 hours (purple line) (A). Following removal of Dox, the Pdx1 level slowly begins to decline, which can be seen after 28 hours (red line) (4 hours after removal of Dox) (B). The Pdx1 level continues to decline from 28 hours (red line) to 32 hours (blue line) (8 hours after removal of Dox), before eventually reaching the lowest point after 48 hours (purple line) (24 hours after removal of Dox) (B). Slowly, from 48 hours (purple line (B)) to 60 hours (red line (C)) (36 hours after removal of Dox) and through to 72 hours (blue line (C)) (48 hours after removal of Dox), the Pdx1 level recovers and gradually approaches the initial level found at 0 hours (red line (a)). Panel a-c constitutes a single experiment, representative of three independent experiments. The bars in figure g represent averages of the relative Pdx1 levels found in the three independent experiments. Student’s T-test assuming unequal variances was applied to test whether Pdx1 levels at the time points were different to the level at 0 hours”*” or 24 hours (time of Dox removal)”#”. * P<0.05, ** P<0.01, # P<0.05, ## P<0.01, ### P<0.005. Confocal microscopical analysis of the samples analysed on the FACS and later supplied with DNA binding fluorophore DAPI confirm the FACS data (D, E and F). The images reveal a visible increase in Pdx1 from 0 hours (D) to the peak at 24 hours (E) and clear decline to 48 hours (F). Error bars are sd. |
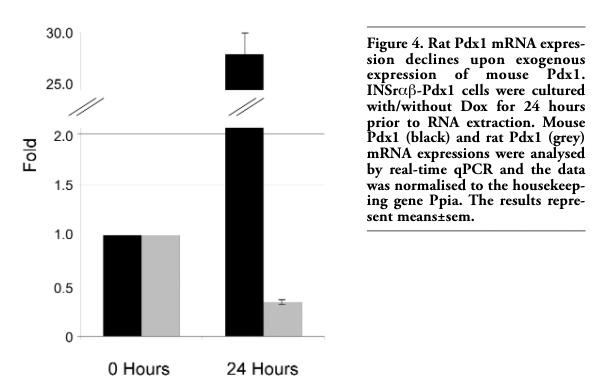 |
Figure 4. Rat Pdx1 mRNA expression declines upon exogenous expression of mouse Pdx1. INSrαβ-Pdx1 cells were cultured with/without Dox for 24 hours prior to RNA extraction. Mouse Pdx1 (black) and rat Pdx1 (grey) mRNA expressions were analysed by real-time qPCR and the data was normalised to the housekeeping gene Ppia. The results represent means±sem. |
The two new Pdx1-specific monoclonal mouse antibodies, F6 and F109, could hence be added to our previously published panel of reagents for the immunohistochemical detection of critical pancreatic transcription factors including Ngn3,37 Nkx6.132 and Ptf1a.38 These monoclonals are important tools for investigations aimed at understanding the mechanisms of pancreatic development from the earliest budding stages to the final differentiation of mature insulin secreting b-cells. In particular, they will be of great value in FACS studies and for multi-label immunohistochemistry. Polyclonal antisera against Pdx1 have been available for more than 10 years and to our knowledge F6 and F109 represent the first monoclonal anti-Pdx1 antibodies useful for FACS as well as for immunohistochemical applications.
In this study, we used the F6 monoclonal antibody to characterize the induction of Pdx1 protein in INSrαβ-Pdx1 cells by Fluorescence-Activated Cell Sorting (FACS) analysis. Our FACS results show that the fluorescence intensity before induction follows a normal distribution as expected for a homogenous cell population. After induction with Dox, the normal distribution of the fluorescence intensity is maintained as the mean fluorescence intensity increases and subsequently decreases, indicating that the entire INSrαβ-Pdx1 cell population responds homogenously. Furthermore, our FACS results show that Pdx1 is induced within hours after addition of Dox and continues to increase up to 24 hours. Removal of Dox results in a decrease in Pdx1 levels, which reach their lowest point 24 hours after removal of Dox. Surprisingly, at this point we find Pdx1 levels to be significantly lower than before Dox stimulation (0 hours), indicating a possible negative feedback loop. A substantial amount of existing literature shows that Pdx1 can bind to its own promoter sequence21,39,40 and a role for Pdx1 in controlling its own promoter activity through a positive feedback mechanism has previously been suggested.20,40 However, our finding that Pdx1 has a repressive effect upon its own expression is further supported by qPCR data that show a 3-fold decline in endogenous Pdx1 mRNA 24 hours after induction with Dox. This 3-fold decline in endogenous Pdx1 mRNA could be due to general squelching resulting from the over expression of mouse Pdx1 by addition of Dox. However, an array study was performed on the INSrαβ-Pdx1 cells to exclude this possibility. Twenty six hours after induction with Dox, 16% of the probe sets were differentially regulated and 48 hours after induction, only 12% of the probe sets were differentially regulated (H. Bang-Berthelsen manuscript in preparation). Among the differentially regulated genes, there are many genes expected to be regulated negatively or positively by Pdx1, substantiating the validity of the system. Yet, further studies are needed to clarify the mechanism of this novel negative feedback loop. We propose a model in which increased amounts of Pdx1 protein lead to an up-regulation of a negative regulator of the Pdx1 gene, resulting in the normalization of Pdx1 protein levels.
The availability of these new monoclonal antibodies through the Developmental Studies Hybridoma Bank (http://dshb.biology. uiowa.edu) will aid such studies.
1. Jonsson J, Carlsson L, Edlund T, Edlund H. Insulin-Promoter-Factor 1 is required for pancreas development in mice. Nature 1994;371:606-9. [PubMed]
2. Offield MF, Jetton TL, Labosky PA, Stein R, Magnuson MA, Hogan BLM et al. Pdx-1 is required for pancreatic outgrowth and differentiation of the rostral duodenum. Development 1996;112:983-95[PubMed]
3. Stoffers DA, Zinkin NT, Stanojevic V, Clarke WL, Habener JF. Pancreatic agenesis attributable to a single nucleotide deletion in the human IPF1 gene coding sequence. Nat Genet 1997;15:106-10. [PubMed]
4. Ahlgren U, Jonsson J, Jonsson L, Simu K, Edlund H. β-Cell-specific inactivation of the mouse Ipf1/Pdx1 gene results in loss of the β-cell phenotype and maturity onset diabetes. Genes Dev 1998;12:1763-8. [PubMed]
5. Holland AM, Gonez LJ, Naselli G, MacDonald RJ, Harrison LC. Conditional expression demonstrates the role of the homeodomain transcription factor Pdx1 in maintenance and regeneration of β-cells in the adult pancreas. Diabetes 2005;54:2586-95. [PubMed]
6. Ohlsson H, Thor S, Edlund T. Novel insulin promoter- and enhancer-binding proteins that discriminate between pancreatic α- and β-cells. Mol Endocrinol 1991;5:897-904. [PubMed]
7. Ohlsson H, Karlsson K, Edlund T. IPF1, a homeodomain-containing transactivator of the insulin gene. EMBO J 1993;12:4251-9[PubMed]
8. Petersen HV, Serup P, Leonard J, Michelsen BK, Madsen OD. Transcriptional regulation of the human insulin gene is dependent on the homeodomain protein STF1/IPF1 acting through the CT boxes. Proceedings of the National Academy of Sciences USA 1994;91:10465-9.[PubMed]
9. Stoffers D, Ferrer J, Clarke W, Habener J. Early-onset type-II diabetes mellitus (MODY4) linked to IPF1. Nat Genet 1997; 17:138-9.[PubMed]
10. Øster A, Jensen J, Serup P, Galante P, Madsen OD, Larsson L-I. Rat endocrine pancreatic development in relation to two homeobox gene products (Pdx-1 and Nkx 6.1). J Histochem Cytochem 1998; 46:707-15. [PubMed]
11. Jørgensen MC, Ahnfelt-Rønne J, Hald JMadsen OD, Serup P, Hecksher-Sørensen J. An illustrated review of early pancreas development in the mouse. Endocr Rev 2007;28: 685-705. [PubMed]
12. Gannon M, Ables ET, Crawford LLowe D, Offield MF, Magnuson MA et al. Pdx-1 function is specifically required in embryonic beta cells to generate appropriate numbers of endocrine cell types and maintain glucose homeostasis. Dev Biol 2008;314;406-17. [PubMed]
13. Pedersen JK, Nelson SB, Jorgensen MC, Henseleit KD, Fujitani Y, Wright CVE et al. Endodermal expression of Nkx6 genes depends differentially on Pdx1. Dev Biol 2005;288:487-501. [PubMed]
14. Waeber G, Thompson N, Nicod P, Bonny C. Transcriptional activation of the GLUT2 gene by the IPF-1/STF-1/IDX-1 homeobox factor. Mol Endocrinol 1996;10:1327-34. [PubMed]
15. Serup P, Jensen J, Andersen FG, Jorgensen MC, Blume N, Holst JJ et al. Induction of insulin and islet amyloid polypeptide production in pancreatic islet glucagonoma cells by insulin promoter factor 1. PNAS 1996;93:9015-20.[PubMed]
16. Watada H, Kajimoto Y, Miyagawa J, Hanafusa T, Hamaguchi K, Matsuoka T et al. PDX-1 induces insulin and glucokinase gene expressions in alphaTC1 clone 6 cells in the presence of betacellulin. Diabetes 1996;45: 1826-31. [PubMed]
17. Leonard J, Peers B, Johnson T, Ferreri K, Lee S, Montminy MR. Characterization of somatostatin transactivating factor-1, a novel homeobox factor that stimulates somatostatin expression in pancreatic islet cells. Mol Endocrinol 1993;7: 1275-83. [PubMed]
18. Miller CP, McGehee RE, Habener JF. IDX-1: a new homeodomain transcription factor expressed in rat pancreatic islets and duodenum that transactivates the somatostatin gene. EMBO J 1994;13:1145-56. [PubMed]
19. Swift GH, Liu Y, Rose SD, Bischof LJ, Steelman S, Buchberg AM et al. An endocrine-exocrine switch in the activity of the pancreatic homeodomain protein PDX1 through formation of a trimeric complex with PBX1b and MRG1 (MEIS2). Mol Cell Biol 1998;18:5109-20. [PubMed]
20. Ber I, Shternhall K, Perl S, Ohanuna Z, Goldberg I, Barshack I et al. Functional, persistent, and extended liver to pancreas transdifferentiation. J Biol Chem 2003;278: 31950-7. [PubMed]
21. Gerrish K, Cissell MA, Stein R. The role of hepatic nuclear factor 1 alpha and PDX-1 in transcriptional regulation of the pdx-1 gene. J Biol Chem 2001;276:47775-84. [PubMed]
22. Wang H, Maechler P, Ritz-Laser B, Hagenfeldt KA, Ishihara H, Philippe J et al. Pdx1 level defines pancreatic gene expression pattern and cell lineage differentiation. J Biol Chem 2001;276:25279-86. [PubMed]
23. Bergholdt R, Karlsen AE, Hagedorn PH, Aalund M, Nielsen JH, Kruhoffer M et al. Transcriptional profiling of type 1 diabetes genes on chromosome 21 in a rat beta-cell line and human pancreatic islets. Genes Immun 2007;8:232-8. [PubMed]
24. Nielsen K, Kruhoffer M, Orntoft T, Sparre T, Wang H, Wollheim C et al. Gene expression profiles during beta cell maturation and after IL-1beta exposure reveal important roles of Pdx-1 and Nkx6.1 for IL-1beta sensitivity. Diabetologia 2004;47:2185-99. [PubMed]
25. Zhang X, Sun N, Wang L, Guo H, Guan Q, Cui B et al. AMP-activated protein kinase and pancreatic/duodenal homeobox-1 involved in insulin secretion under high leucine exposure in rat insulinoma beta-cells. J Cell Mol Med 2009;13:758-70. [PubMed]
26. Wang H, Iezzi M, Theander S, Antinozzi PA, Gauthier BR, Halban PA et al. Suppression of Pdx-1 perturbs proinsulin processing, insulin secretion and GLP-1 signalling in INS-1 cells. Diabetologia 2005; 48:720-31. [PubMed]
27. Peers B, Leonard J, Sharma S, Teitelman G, Montminy M. Insulin expression in pancreatic islet cells relies on cooperative interactions between the helix loop helix factor E47 and the homeobox factor STF-1. Mol Endocrinol 1994;8:1798-806. [Abstract]
28. Jensen J, Serup P, Karlsen C, Nielsen TF, Madsen OD. mRNA Profiling of rat islet tumors reveals Nkx 6.1 as a beta-cell-specific Homeodomain Transcription Factor. J Biol Chem 1996; 271:18749-58. [PubMed]
29. Larsson L-I, Madsen OD, Serup P, Jonsson J, Edlund H. Pancreatic-duodenal homeobox 1 -role in gastric endocrine patterning. Mech Dev 1996;60:175-84. [PubMed]
30. Taggart R, Samloff I. Stable antibody-producing murine hybridomas. Science 1983;219: 1228-30. [PubMed]
31. Harlow E, Lane D. Antibodies: A Laboratory Manual. Cold Spring Harbor Laboratory Press; 1980.
32. Pedersen IL, Klinck R, Hecksher-Sorensen J, Zahn S, Madsen OD, Serup P. Generation and Characterization of Monoclonal antibodies against the transcription factor Nkx6.1. J Histochem Cytochem 2006;54:567-74. [PubMed]
33. Ahnfelt-Ronne J, Jorgensen MC, Hald J, Madsen OD, Serup P, Hecksher-Sorensen J. An improved method for three-dimensional reconstruction of protein expression patterns in intact mouse and chicken embryos and organs. J Histochem Cytochem 2007;55:925-30. [PubMed]
34. D'Ambra R, Surana M, Efrat S, Starr R, Fleischer N. Regulation of insulin secretion from beta-cell lines derived from transgenic mice insulinomas resembles that of normal beta-cells. Endocrinology 1990;126:2815-22.[PubMed]
35. Hamaguchi K, Leiter E. Comparison of cytokine effects on mouse pancreatic alpha-cell and beta-cell lines. Viability, secretory function, and MHC antigen expression. Diabetes 1990;39:415-25. [PubMed]
36. Livak KJ, Schmittgen TD. Analysis of relative gene expression data using real-time quantitative PCR and the 2(-Delta Delta C(T)) method. Methods 2001;25:402-8. [PubMed]
37. Zahn S, Hecksher-Sorensen J, Pedersen IL, Serup P, Madsen O. Generation of monoclonal antibodies against mouse neurogenin 3: a new immunocytochemical tool to study the pancreatic endocrine progenitor cell. Hybrid Hybridomics. 2004;23:385-8. [PubMed]
38. Hald J, Sprinkel AE, Ray M, Serup P, Wright C, Madsen OD. Generation and characterization of Ptf1a antiserum and localization of Ptf1a in relation to Nkx6.1 and Pdx1 during the earliest stages of mouse pancreas development. J Histochem Cyto- chem 2008;56:587-95.[PubMed]
39. Chakrabarti SK, James JC, Mirmira RG. Quantitative assessment of gene targeting in vitro and in vivo by the pancreatic transcription factor, Pdx1. Importance of chromatin structure in directing promoter binding. J Biol Chem 2002;277:13286-93.[PubMed]
40. Keller DM, McWeeney S, Arsenlis A, Drouin J, Wright CV, Wang H et al. Characterization of pancreatic transcription factor Pdx-1 binding sites using promoter microarray and serial analysis of chromatin occupancy. J Biol Chem 2007;282:32084-92.[PubMed]
[TOP]