I.N. Vatsos,1 Y. Kotzamanis,2 M. Henry,2 P. Angelidis,1 M. N. Alexis2
1Ichthyology Lab, Faculty of Veterinary Medicine, Aristotle University of Thessaloniki, Greece 2Institute of Aquaculture, Hellenic Centre for Marine Research, Athens, Greece
Correspondence: I.N. Vatsos, Department of Animal Production, Ichthyology, Ecology and Protection of Environment, Faculty of Veterinary Medicine, Aristotle University of Thessaloniki, TK 54124, Greece.
Tel. +30.2310.999880 - Fax: +30.2310.999871.
E-mail: ivatsos@vet.auth.gr
Key words: fish, image analysis, mucous cells, nitrate, oxygen, stress.
Contribution: INV, experimental design (experiment A and B), acquisition, analysis and interpretation of data, drafting and critical review of the manuscript. Final approval; YK, Experimental design (experiment A), acquisition, analysis and interpretation of data, critical review of the manuscript. Final approval; MH, Analysis and interpretation of data, critical review of the manuscript. Final approval; PA, Analysis and interpretation of data, critical review of the manuscript. Final approval; MN Alexis: Experimental design (experiment B), analysis and interpretation of data, critical review of the manuscript. Final approval.
This work is licensed under a Creative Commons Attribution 3.0 License (by-nc 3.0).
©Copyright I.N. Vatsos et al., 2010
Licensee PAGEPress, Italy
European Journal of Histochemistry 2010; 54:e22
doi:10.4081/ejh.2010.e22
AbstractSeveral authors have previously demonstrated that the number of the skin mucous cells of fish is affected by many stressors. In the present study, two experiments were conducted in order to examine the effects of two common environmental conditions on the morphology of skin of sea bass and particularly on the number and diameter of skin mucous cells. In the first experiment, two groups of sea bass (mean weight 155.6±10.3 g SD) were maintained in two different concentrations of nitrate, 100 and 700 ppm respectively, for 48 h, while a third group was used as control. In the second experiment, sea bass (initial mean weight 78.9±3.1 g SD) were divided into four groups and each group was maintained in a different level of oxygen for 9 weeks. The oxygen concentration in each group was: 3.6±0.2 ppm, 4.7±0.2 ppm, 6.2±0.2 ppm and 8.2±0.2 ppm. In both experiments the effects of the two environmental factors on the morphology of the fish skin were examined histologically and a software containing a visual basic script macro, allowing quantification of the skin mucous cells, was used to analyze the skin tissue sections. Concerning the overall morphology of the skin and the diameter of the skin mucous cells, no differences were noted in both experiments (P>0.05). It was demonstrated however, that fish maintained in the lowest oxygen level and fish maintained in the highest concentration of nitrate exhibited significantly increased number of mucous cells per skin area (mm2). There is evidence that the enumeration of the skin mucous cells of fish can be used to monitor stress in fish.
|
Fish living in the confined environment of a fish farm very often encounter adverse situations, which in nature either do not exist or have negligible effect on them. In addition, under farming conditions, fish cannot avoid these conditions and this causes stress, increasing their susceptibility to many diseases.1 Increased levels of nitrate in the water and prolonged environmental hypoxia are two environmental conditions that are very often observed in intensive fish farming.
Nitrate is generally considered of low toxicity to fish. It is produced by a two-step process called ‘nitrification’. During this process, ammonia, which is either excreted from fish or produced by the decomposition of the organic matter in the water, is first oxidized to nitrite (NO2–) and subsequently to nitrate (NO3–).2 In most aquaculture systems, nitrate levels are below 50 mg L–1, but in intensive culture systems, especially in recirculation systems, nitrate levels often exceed 100 ppm3 causing problems to fish, especially to younger ones.4 Different fish species exhibit different tolerance to nitrate.5 For example, long-term exposure of chinook salmon (Oncorhynchus tschawytscha) fry to 20 ppm resulted in significantly increased mortality, while increased mortality in rainbow trout (Oncorhynchus mykiss) fry was observed when the concentration of nitrate in the water exceeded 10 ppm. For coho salmon (Oncorhynchus kisutch), exposure to higher nitrate concentration (30 ppm) caused increased fry mortalities.4 On the other hand, however, short-term exposure of fish to nitrate seems to induce less significant effects. For example, larvae of four marine fish species were found to be tolerant to a 24h-exposure to very high nitrate levels with LC50, ranging from 2900 to 6850 ppm.6
Oxygen is one of the most important limiting factors in aquaculture. Fishes cultured in areas where the water exchange is low, such as lagoons, may encounter long-term hypoxia in summer months. Reduced dissolved oxygen in the aquatic environment can induce physiological as well as morphological alterations in fish7,8,9 and depending on the level of hypoxia fish exhibit behavioural changes, reduction in the growth rate or even increased mortalities. The oxygen level below which growth is significantly affected depends on the fish species. Thus, in some species, such as Onchorhychus kisutch, O. nerka, Micropterus salmoides, Cyprinus carpio and Dicentrarchus labrax, oxygen concentrations below 4-5 ppm appear to have significant effect on growth,10,11,12 while in other species, such as O. mykiss, the above threshold is around 7 ppm.13
Several previous studies have demonstrated that many adverse biotic as well as abiotic environmental factors, such as increased concentration of ammonia in the water, acidified or organically fertilized water; and heavy metals can affect the morphology and structure of the fish skin and particularly the distribution of skin mucous cells.14,15,16,17,18,19 Thus, many authors suggested that the number of skin mucous cells can be used as a stress index for fish. In the present study, the potential of using the alteration in the number of the skin mucous cells of sea bass (Dicentrarchus labrax) as a stress index was examined. For this purpose, after exposing the fish to increased levels of nitrate and long-term environmental hypoxia, skin tissue samples were collected and tissue sections were examined using a simple image analysis technique.
Sea bass (n: 45, mean weight 155.6±10.3 g SD) were randomly divided into 3 groups and placed into nine 100 L tanks (3 replicates in each group; 5 fish per tank). After acclimatizing the fish for one week, the water flow in each tank was stopped and nitrate in the form of sodium nitrate was added to the water. In the first three tanks (Group A) the concentration of nitrate in the seawater was 100 ppm (final concentration) and in the following 3 tanks (Group B) the concentration was 700 ppm (final concentration). The fish in the remaining 3 tanks (Group C) were kept as controls (nitrate tank concentration 1.1±0.3 ppm SD). The salinity of the seawater was 38‰, and its temperature ranged 23.7-24.5°C. During the experimental period (48 hours) the fish were not fed and tank water was constantly aerated. The overall health status of the fish was monitored and the mortalities were recorded daily. A constant artificial period of 14 h light and 10 h darkness was applied throughout the experimental period.
At the end of the experimental period 3 fish per tank (9 per group) were sampled for examination. From each fish, skin tissue samples were collected as described below.
Sea bass (n: 520; initial mean weight 78.9±3.1 g) were placed in eight 1 m3 tanks. The fish were then divided into four groups, (two tanks - replicates in each group). Each tank was supplied with 250 L/h seawater, (salinity: 38‰ and dissolved oxygen 7.5±0.2 ppm. Throughout the experimental period the temperature of the water was 26±1°C. The tanks were covered with black plastic covers and artificial photoperiod of 14 h light/10 h darkness was applied. The fish were left for two weeks inside the tanks to acclimatize before the oxygen concentration in the water of each group was gradually (in two days) set to: Group 1: 3.6±0.2 ppm (approximately 58% oxygen saturation, hypoxia), Group 2: 4.7±0.2 ppm (approximately 76% oxygen saturation, mild hypoxia), Group 3: 6.2±0.2 ppm (approximately 100% oxygen saturation, normoxia, control group) and Group 4: 8.2±0.2 ppm (approximately 132% oxygen saturation, mild hyperoxia). The oxygen depletion in each tank water was achieved by mean of fish’s oxygen consumption, while the oxygen levels were maintained constant through air-stones. The differences in the oxygen concentration between the two replicates in each group throughout the experiment were no more than ±0.4 ppm. The oxygen in each tank was supplied by air-stones placed along the water entrance into the tanks. The oxygen levels were monitored and adjusted continuously by electrodes (Dryden Aqua), linked to a computer. The electrodes were placed inside the first tank of each group and the oxygen flow was regulated by electric switches, which were also connected to the computer. The oxygen levels in each tank were also measured twice a week using the Winkler method20 and calibration of the electrodes were made when necessary.
The fish received twice a day (at 8:30 am and 3:00 pm) commercial feed (Biomar Ecolife 64, 4.5 mm, total protein 44%, total fat 20%, total carbohydrates 15.8%, ash 8.2%). Feed distribution was performed by hand through a plastic transparent tube to satiation. The fish behavior during feeding and throughout the day was observed through a small opening of the plastic cover. The feeding was stopped when a few pellets remained uneaten at the bottom of the tanks. The pellets not consumed by the fish were then collected in a mesh from the tap at the bottom of the tanks. The overall health status of the fish was also monitored and the mortalities were recorded daily.
During the experiment, three samplings were carried out on week 3, 6 and 9, after the adjustment of the oxygen levels. On these occasions, four fish from each tank (eight per group) were swiftly and carefully captured and anesthetised immediately in phenoxylethanol (0.5 mL L–1) in order to collect skin samples as described below.
In order to assess the ammonia concentrations in the tanks water, three water samples from each tank (the first just before the first feeding, the second two hours after the feeding and the third one hour before the second feeding) were collected on day 4, 25, 50, of the experiment and the total ammonia concentrations in the samples were calculated according to Solorzano.21
In order to examine the effects of nitrate and oxygen on the skin of sea bass, from each sampled fish skin tissue samples were cut from the head area between the eyes. The tissue samples were fixed in 10% buffered formalin for 24 h at room temperature. The samples were then processed according to conventional histological procedures.22 At least three 4 µm thick, not consecutive sections were cut from each tissue sample and mounted on glass slides.
In order to stain the tissue sections with Alcian blue / Periodic Acid Schiff (PAS) the slides were first immersed in xylene for 5 min and then in absolute alcohol for 2 min, and finally in methanol for 5 min. After being washed in distilled water for 2 min, the sections were stained with Alcian blue (SIGMA, 8GX) solution (5% w v–1 alcian blue in 3% v v–1 acetic acid pH 2.6) for 1 h. The slides were washed again with distilled water and then immersed in 0.5% v v–1 periodic acid (BDH) for 15 min. The slides were then placed into Schiff’s reagent (FLUKA) for 15 min. After being briefly washed in tap water, the slides were placed into methanol for 30 sec and then transferred into two absolute alcohol baths for 2 and 1.5 min, respectively. The slides were then placed again into xylene for 5 min, and finally mounted with coverslips using DPX (BDH). All stages were carried out at room temperature. The sections were observed using an Olympus AH2 light microscope, equipped with a camera (Sony, CCD-IRIS) connected to a computer. Image Pro Plus 3 software, which contained a visual basic script macro, that allowed quantification of skin parameters, was used to analyze the tissue sections. At least four areas per skin section (twelve per fish) were observed. The general structure of the skin and the size (mean diameter) and number of skin mucous cells were examined.
SPSS ver. 16 software was used to analyze the various measurements and the means were compared with one way analysis of variance (ANOVA), following tests for normality and homogeneity. Tukey test was employed to identify significantly different groups, where P≤ 0.05 was considered significant.
In both experiments, no mortalities were recorded in the groups and no differences in the overall fish behavior were observed. In Experiment B, total ammonia (TA-N) concentration in the tanks was 0.2 mg L–1 before the first feeding, 0.7 mg L–1 two hours after the first feeding, and then dropped again.
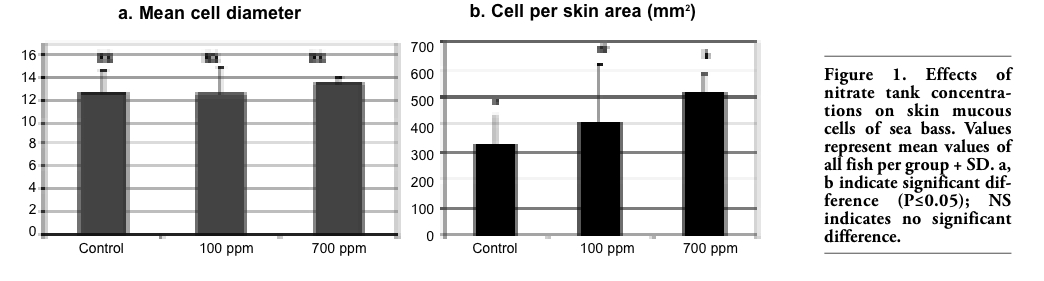
Concerning the histological examination of the skin tissue sections, no differences in the general structure of the skin among the different groups were observed in either experiments, nor significant differences in the mean diameter of the skin mucous cells (Figure 1a, Figure 2a). On the other hand, in both experiments fish maintained in the lowest oxygen level and fish maintained in the highest level of nitrate exhibited significantly increased number of mucous cells per skin area (mm2) (Figure 1b, Figure 2b, Figure 4). Specifically, in the first experiment, the significant difference observed was between fish maintained in the highest concentration of nitrate (Group B) and control group (Group C), while in the second experiment the difference observed was among fish maintained in hypoxia (Group 1) and the other groups in all the samplings. It should be noted that only in the second sampling (week 6) between Groups 1 (hypoxia) and 2 (mild hypoxia) no significant difference was observed, and in the last sampling the difference observed among Group 1 and the other groups appeared more pronounced.
In Experiment B, the mean number of skin mucus cells in each group changed in each sampling (Figure 3). For all groups of fish, this number reached a peak after 6 weeks and decreased significantly at the end of the experimental period (week 9).
It is worth noticing that in both experiments, in all groups few mucous cells per section (1-2 per section) appeared to contain neutral glycoproteins (stained magenta) (Figure 5). Especially in sections, where the number of mucous cells was low, no neutral mucous cells were observed.
|
Figure 1. Effects of nitrate tank concentrations on skin mucous cells of sea bass. Values represent mean values of all fish per group + SD. a, b indicate significant difference (P≤0.05); NS indicates no significant difference. |
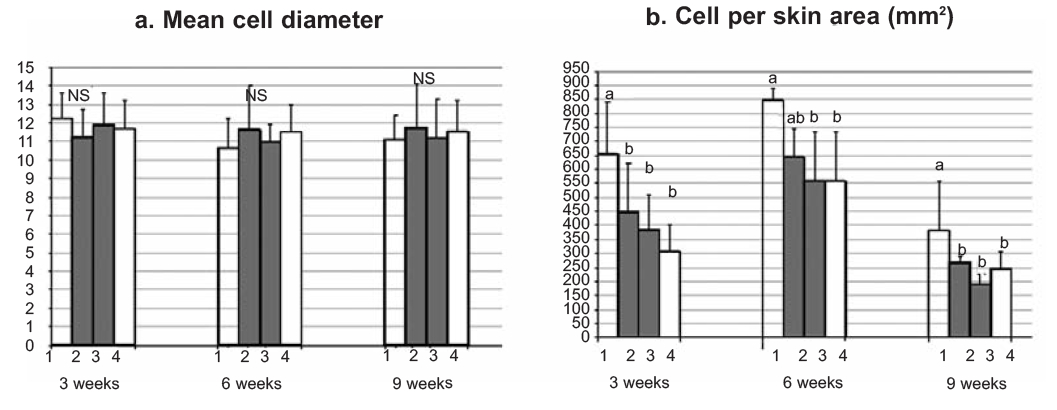 |
Figure 2. Effects of oxygen tank concentrations on skin mucous cells of sea bass. Values represent mean values of all fish per group + SD. a, b indicate significant difference (P≤0.05); NS indicates no significant difference. |
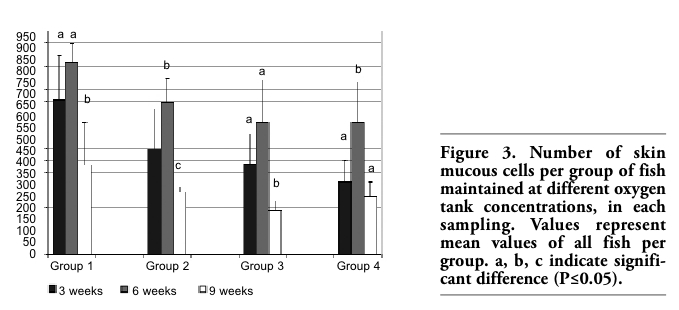 |
Figure 3. Number of skin mucous cells per group of fish maintained at different oxygen tank concentrations, in each sampling. Values represent mean values of all fish per group. a, b, c indicate significant difference (P≤0.05). |
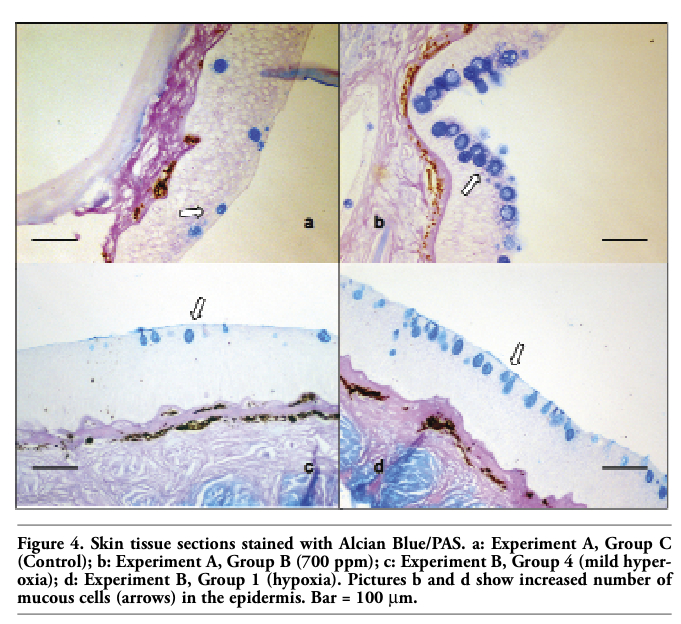 |
Figure 4. Skin tissue sections stained with Alcian Blue/PAS. a: Experiment A, Group C (Control); b: Experiment A, Group B (700 ppm); c: Experiment B, Group 4 (mild hyperoxia); d: Experiment B, Group 1 (hypoxia). Pictures b and d show increased number of mucous cells (arrows) in the epidermis. Bar = 100 μm. |
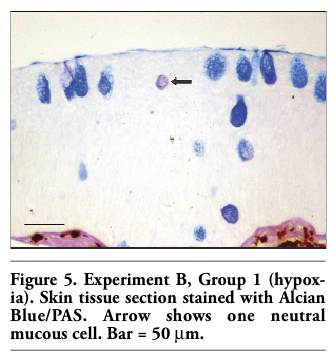 |
Figure 5. Experiment B, Group 1 (hypoxia). Skin tissue section stained with Alcian Blue/PAS. Arrow shows one neutral mucous cell. Bar = 50 μm. |
There is a great number of techniques that can be used to assess stress in fish, as Pottinger23 describes. In practice however, the most commonly used method is assessing cortisol levels in the blood or in other samples, such as bile, faeces, or even water. Nevertheless, in many cases such approaches can be quite problematic as they depend on many intrinsic as well as extrinsic to the fish factors.23 In addition, there are some stressful conditions, such as chronic confinement, where cortisol levels in the blood remain unaffected.24
The skin of the fish is a major organ that plays an important role in osmoregulation and acts as the first protective barriers against many invading agents. In many cases, non-specific alterations in the morphology of the fish skin, especially in its coloration, are the first signs indicating the presence of a stressful and potentially hazardous condition. Among these alterations in the fish skin, which are associated with many stressful conditions, there are number and size of the mucous cells located in the epidermis of skin.25 These cells are responsible for the production of the mucus that covers the fish body.
Although the physiological mechanism leading to alteration in the number of skin mucous cells in various stressful conditions is still not clear, Iger et al.26 demonstrated that this mechanism is not cortisol-related. This has also been confirmed by van der Salm et al.27 It is well known that a continuous secretion and shedding of mucus produced by skin mucous cells, together with the presence in the mucus of many substances, such as immunoglobulin, complement, lysozyme and lectin protect the fish against various infections.28 Zaccone29 concluded that since the mucus on the fish skin also reduces the friction with water, the increase in the mucus secretion observed under adverse situations can be considered as a non-specific response of fish, which helps them swimming to favourable areas. Iger and Abraham,30 based on qualitative findings from many studies in many fish species, suggested that the enumeration of skin mucous cells could be used as an indicator of exposure to a stressor.
In the present studies, the two stressful conditions examined did not affect significantly the overall structure of the fish skin; nevertheless, they had a notable effect on the number of the mucous cells in the epidermis. Previous reports have already indicated that the conditions used in the present study are stressful for sea bass. Vectesi et al.31 reported that sea bass exposed to the same levels of nitrate studied by us (100 ppm and 700 ppm) exhibited a tendency to increased haemoglobin concentration in the blood. In addition, the whole blood respiratory burst activity measured by chemiluminescence also tended to be stronger in the fish maintained in both concentrations of nitrate. On the other hand, the total number of blood cells and the bactericidal activity of the serum of the fish maintained in 100 and 700 ppm, tended to decrease. These findings indicated immediate response of fish to acute stress. On the other hand, sea bass exposed to 3.6 ppm oxygen for the same period exhibited decreased specific growth rate (SGR) and feed efficiency,32 especially in the last 6 weeks of the experiment. The negative effect of severe hypoxia on the growth of sea bass has also been reported by other authors.12,33 Therefore, the increased numbers of skin mucous cells that were observed in the two experiments are considered a non-specific response of sea bass to the adverse conditions they were exposed to. It is worth noticing that no statistical differences in the mean diameter of the mucus cells were noted in both experiments. Ledy et al.,18 using image analysis to study the effect of acidic aluminium-containing stream water on the skin of brown trout (Salmo trutta fario), reported an increase in the size of mucus cells in the epidermis, in addition to their increased number. It is possible that when the stimulation of mucous cells is significant, hypertrophy as well as hyperplasia of these cells is observed. In addition, the response of mucous cells to a specific stressor can be related to the species of fish, as Zuchelkowski et al.25 concluded. These authors observed only hyperplasia and not hypertrophy of the mucous cells after exposing brown bullhead (Ictalurus nebulosus) to acid environment.
Interestingly, in the second experiment the number of skin mucous cells in all groups appeared to change throughout the experimental period, showing a progressive decrease by the end of the experimental period. Although no measurement was carried out before the experiment start, it seems that this pattern, common for all groups including the control group, may reflect a progressive adaptation of all fish to the new environment. Nevertheless, the additional effect of the different concentrations of oxygen on these cells was still evident.
Another interesting finding was the fact that in both experiments, in all skin samples observed, almost all mucous cells stained blue, indicating that these cells contained acid glycoproteins. No further differentiation between sialomucins and sulphomucins was carried out. Although the present study cannot provide an explanation as to the reason that almost no neutral mucous cells were observed, it is hypothesised that since the increased number of acid mucous cells is associated with an increase in the viscosity of mucus,34 which in turn increases the protective role of mucus and further reduces the friction with the water, this phenomenon can be associated with the presence of the two stressful conditions. Furthermore, as it was shown, there was also an additional stress for the fish, due to the new environment in which they were recently transferred.
In the present study, the effect of chronic environmental hypoxia and increased level of nitrate in the water on the skin mucous cells of fish was demonstrated for the first time. Although more stressors need to be examined, based on the findings of this study and those of others, it is believed that the enumeration of skin mucous cells can be a reliable index to monitor stress in fish and a simple image analysis technique, as the one described here, can be a very useful tool.
1. Huntingford FA, Adams C, Braithwaite VA, Kadri S, Pottinger TG, Sandøe P et al. Current issues in fish welfare. J Fish Biol 2006;60:332-72. [FullText]
2. Hargreaves JA, Tucker CS. Managing ammonia in fish ponds. SRAC Publication, 2004; No. 4603:8.
3. Hrubec TC, Robertson JL, Smith S, Tinker MK. The effect of temperature and water quality on antibody response to Aeromonas salmonicida in sunshine bass (Morone chrysops x Morone saxatilis). Vet Immunol Immunopathol 1996;50:157-66. [PubMed]
4. Kincheloe JW, Weoemever G, Koch OL. Tolerance of developing salmonid eggs and fry to nitrate exposure. Bull Environ Con Toxicol 1979;23:575-8. [PubMed]
5. Doblander C, Lackner R. Metabolism and detoxification of nitrite by trout hepatocytes. Biochim Biophys Acta 1996;1289: 270-4. [PubMed]
6. Brownell CL. Water quality requirements for first-feeding in marine fish larvae. I. Ammonia, nitrite and nitrate. J Exp Mar Biol Ecol 1980;44:269-83. [Abstract]
7. Medale F. Influence of a decrease in water oxygen concentration throughout a long period on some aspects of nitrogen metabolism in rainbow trout (Salmo gairdneri Rich.). Univ. Paul Sabatier, Lab. Ecophysiol. Poissons, Toulouse (France), 1985.
8. Barton BA, Taylor BR. Oxygen requirements of fishes in northern Alberta rivers with a general review of the adverse effects of low dissolved oxygen. Water Qual Res J Can 1996;31:361-409. [FullText]
9. Val AL, Silva MNP, Almeida-Val VMF. Hypoxia adaptation in fish of the Amazon: a never-ending task. S Afr J Zool 1998;33: 107-14.
10. Brett JR. Environmental factors and growth. In: Hoar WS, Randall DJ, Brett JR, eds. Fish Physiology Vol. VIII Academic Press, New York. 1979; p. 599-675.
11. Brett JR, Blackburn JM. Oxygen requirements for growth of young coho (Oncorhynchus kisutch) and sockeye (O. nerka) salmon at 15°C. Can J Fish Aquat Sci 1981;38:399-404. [Abstract]
12. Thetmeyer H, Waller U, Black KD, et al. Growth of European sea bass (Dicentrarchus labrax L.) under hypoxic and oscillating oxygen conditions. Aquaculture 1999;174:355-67. [Abstract]
13. Pedersen CL. Energy budgets for juvenile rainbow trout at various oxygen concentrations. Aquaculture 1987;62:289-98. [Abstract]
14. Iger Y, Abraham M, Dotan A, Fattal B, Rahamim E. Cellular responses in the skin of carp maintained in organically fertilized water. J Fish Biol 1988;33:711-20. [Abstract]
15. Khangarot BS, Tripathi DM. The stereoscan observations of the skin of catfish, Sacobranchus fossilis, following chromium exposure. J Environ Sci Health, A 1992;27:1141-8. [Abstract]
16. Iger Y, Lock RAC, Jenner HA, Wendelaar Bonga SE. Cellular responses in the skin of carp (Cyprinus carpio) exposed to copper. Aquat Toxicol 1994;29:49-64. [Abstract]
17. Iger Y, Wendelaar Bonga SE. Cellular responses of the skin of carp (Cyprinus carpio) exposed to acidified water. Cell Tissue Res 1994;275:481-92. [Abstract]
18. Ledy K, Giambérini L, Pihan JC. Mucous cell responses in gill and skin of brown trout Salmo trutta fario in acidic, aluminium-containing stream water. Dis Aquat Org 2003;56:235-40. [PubMed]
19. Kalogianni E, Strouboudi MT, Tsangaris K, et al. Morphological alterations in the skin of the sea beam (Sparus aurata) and the sea bass (Dicentrarchus labrax) exposed to high ammonia. 7th Hellenic Symposium on Oceanography and Fisheries. Chersonissos, Greece, 6-9 May 2003. Book of Abstracts; 2003. p. 216.
20. Strickland JD, Parsons TR. A practical hand book of seawater analysis. Bulletin no 167, 2nd edition. Ottawa. Fisheries Research Board of Canada; 1972.
21. Solorzano L. Determination of ammonia in natural waters by the phenolyhypochlorite method. Limnol Oceanogr 1969;14:799-801.
22. Roberts RJ, Snail DA. Laboratory methods. In: Roberts RJ ed. Fish Pathology. W.B. Saunders, UK; 2001. p. 380-412.
23. Pottinger TG. The Stress Response in Fish – Mechanisms, Effects and Measurment. In: Branson EJ ed. Fish Welfare. Blackwell Publishing Ltd, UK 2008; p. 32-48.
24. Barton BA, Ribas L, Acerete L, Tort L. Effects of chronic confinement on physiological responses of juvenile gilthead sea bream, Sparus aurata L., to acute handling. Aquacult Res 2005;36:172-9. [Abstract]
25. Zuchelkowski EM, Lantz RC, Hinton DE. Effects of acid-stress on epidermal mucous cells of the brown bullhead Ictalurus nebulosus (LeSeur): a morphometric study. Anat Rec 1981;200:33-9. [PubMed]
26. Iger Y, Balm PHM, Jenner HA, Wendelaar Bonga SE. Cortisol induces stress-related changes in the skin of rainbow trout (Oncorhynchus mykiss). Gen Comp Endocrinol 1995;97:188-98. [PubMed]
27. van der Salm AL, Nolan DT, Wendelaar Bonga SE. In vitro evidence that cortisol directly modulates stress-related responses in the skin epidermis of the rainbow trout (Oncorhynchus mykiss Walbaum). Fish Physiol Biochem 2004;27:9-18.
28. Shephard KL. Functions for fish mucus. Rev Fish Bio Fisher 1994;4:401-429. [Abstract]
29. Zaccone G. Structure, histochemistry and effect of stress on the epidermis of Ophisurus serpens (L.) (Teleostei: Ophichthidae). Cell Mol Biol Incl Cyto Enzymol 1980;26:663-74. [PubMed]
30. Iger Y, Abraham M. Rodlet cells in the epidermis of fish exposed to stressors. Tissue Cell 1997;29:431-8. [Abstract]
31. Vectesi D, Kotzamanis Y, Henry M, Vatsos IN. Preliminary study on the short-term exposure of sea bass (Dicentrarchus labrax) to high levels of nitrate. Effects on hematological and immunological parameters. Aquaculture Europe 2007, October 24-27,2007, Istanbul, Turkey. Book of Proceedings; 2007. p. 297.
32. Vatsos IN, Kalogiros E, Yiagnisis M, Alexis M. Effect of different levels of oxygen on the growth of sea bass (Dicentrarchus labrax). 8TH Pan-Hellenic Symposium for Oceanography and Fisheries, 4-8 June, Thessaloniki, Greece, Book of Proceedings; 2006. p. 1133-6.
33. Pichavant K, Person-Le-Ruyet J, Le Bayon N, Severe A, Le Roux A, Bœuf G. Comparative effects of long-term hypoxia on growth, feeding and oxygen consumption in juvenile turbot and European sea bass. J Fish Biol 2001;59:875-83. [FullText]
34. Kumari U, Yashpal M, Mittal S, Mittal AK. Histochemical analysis of glycoproteins in the secretory cells in the gill epithelium of a catfish, Rita rita (Siluriformes, Bagridae). Tissue Cell 2009;41:271-80. [PubMed]
[TOP]