M. Riccio,1 E. Resca,1 T. Maraldi,1 A. Pisciotta,1 A. Ferrari,2 G. Bruzzesi,3 A. De Po1
1Department of Anatomy and Histology, University of Modena and Reggio Emilia, Modena, Italy
2Department of Neuroscience, University of Modena and Reggio Emilia, Ospedale Santa Maria Nuova, Reggio Emilia, Italy
3Oro-maxillo-facial Department, AUSL
of Baggiovara, Modena, Italy
Correspondence: Massimo Riccio, Department of Anatomy and Histology, University of Modena and Reggio Emilia, via Del Pozzo 71, 41100 Modena, Italy. Fax: +39.059.4224861.
E-mail: massimo.riccio@unimore.it
Key words: dental pulp stem cell, mesenchymal stem cells, osteogenic differentiation, 3D scaffolds.
Conflict of interest: the authors report no conflict.
Acknowledgements: the authors would like to thank Dr. Monica Montanari (Cell Lab “Paolo Buffa”, Dept. of Biomedical Sciences, University of Modena and Reggio Emilia, Italy) for providing expertise in Flow Cytometry analysis. They also thank Prof. Carla Palumbo for contribution to experimental design and TEM analysis. This work was supported by grants from Fondazione Cassa di Risparmio di Modena, Fondazione Manodori and Regione Emilia Romagna, programma di ricerca Università, Arcispedale S. Maria Nuova di Reggio Emilia. For this study we utilized the confocal microscope Leica TCS SP2 of the C.I.G.S. (Centro Interdipartimentale Grandi Strumenti) of the University of Modena and Reggio Emilia, financed by Fondazione Cassa di Risparmio di Modena, Italy.
Received for publication: 6 September 2010.
Accepted for publication: 1 October 2010.
This work is licensed under a Creative Commons Attribution 3.0 License (by-nc 3.0).
©Copyright M. Riccio et al., 2010
Licensee PAGEPress, Italy
European Journal of Histochemistry 2010; 54:e46
doi:10.4081/ejh.2010.e46
AbstractThe aim of this study was to characterize the in vitro osteogenic differentiation of dental pulp stem cells (DPSCs) in 2D cultures and 3D biomaterials. DPSCs, separated from dental pulp by enzymatic digestion, and isolated by magnetic cell sorting were differentiated toward osteogenic lineage on 2D surface by using an osteogenic medium. During the differentiation process, DPSCs express specific bone proteins like Runx-2, Osx, OPN and OCN with a sequential expression, analogous to those occurring during osteoblast differentiation, and produce extracellular calcium deposits. In order to differentiate cells in a 3D space that mimes the physiological environment, DPSCs were cultured in two distinct bioscaffolds, Matrigel™ and Collagen sponge. With the addition of a third dimension, osteogenic differentiation and mineralized extracellular matrix production significantly improved. In particular, in Matrigel™ cells DPSCs differentiated with osteoblast/osteocyte characteristics and connected by gap junction, and therefore formeding calcified nodules with a 3D intercellular network. Furthermore, DPSCs differentiated in collagen sponge actively secrete human type I collagen micro-fibrils and form calcified matrix containing trabecular-like structures. These neo-formed DPSCs-scaffold devices may be used in regenerative surgical applications in order to resolve pathologies and traumas characterized by critical size bone defects.
|
Adult stem cells have been isolated from a variety of human differentiated tissues such as skin, muscle, adipose tissue, bone marrow or blood. It was generally accepted that the differentiation potential of these stem cells was restricted to generate cells of the origin lineage. Recently some evidences different authors demonstrate that adult stem cells show a multilineage differentiation potential.1
Dental pulp stem cells (DPSCs) represent an adult stem cells population originating from neural crest cells that reside in the perivascular niche of dental pulp and constitute a source of stem cells easily recruitable with low invasivity for the patient.2,3 DPSCs are multipotent cells that typically express the STRO-1 and CD146 antigens and are able to differentiate in osteogenic, chondrogenic, myogenic, adipogenic and neurogenic lineage according to their embryonic origin.4,5 A c-Kit+/CD34+/STRO-1+ DPSC multipotent sub-population, particularly able to differentiate in osteogenic lineage, named SBP-DPSCs, was isolated from DPSCs by flow cytometry. Osteogenic differentiated SBP-DPSCs express bone tissue specific proteins, produce calcified extracellular matrix (ECM) and form nodular cell aggregates and nodular bone in vitro.6,7,8
Osteoblast differentiation occurs by at different stages: it starts with the commitment of mesenchimal cells (MC) in osteoprogenitor cells that differentiate in immature osteoblasts and then in mature osteoblasts. Specific transcription factors induce MC to acquire the osteoblast phenotype and promote the expression of proteins typical of bone tissue. Runx2 is considered the major transcription factor controlling osteoblast differentiation. It is expressed by MC throughout their osteogenic differentiation, and is also present in mature osteoblasts. Osterix (Osx) is a zinc finger transcription factor essential to osteoblast differentiation, acting downstream Runx2, and modulating the expression of important osteoblast proteins such as osteopontin (OPN), osteocalcin (OCN), bone sialoprotein and collagen type I.9,10,11 OPN is a phospho-protein containing several calcium binding domains expressed in differentiating osteoblasts. During bone development it regulates cell adhesion, proliferation and extracellular matrix (ECM) mineralization.12,13 OCN is the major protein of bone matrix involved in the regulation of matrix mineralization. In bone tissue OCN is not present in areas of first crystal formation, but in the mineralised ECM. This suggests that its role may be to control the size and speed of crystal formation.14
DPSCs osteogenic differentiation was previously described but the expression analysis of specific markers was carried out mainly by RT-PCR techniques. This approach does not give gives information about protein synthesized and secreted by differentiating DPSC (dDPSC) during the production of calcified ECM. Protein analysis can elucidate the timing of synthesis and secretion of specific bone proteins giving further information on the maturation degree of synthesized ECM. Only recently a few numbers of papers describe some papers describe the use of DPSCs to colonize 3D bio-scaffolds in order to produce implantable devices.
In this study we analyze the osteogenic differentiation of DPSCs on 2D surface in order to give further evidences evidence regarding their differentiation in osteoblast-like cells. Osteogenic differentiation was then evaluated by Western blot and immunofluorescence analysis of bone-related proteins. The production of calcified ECM was also verified. In a second step, in order to obtain a stem cell-bioscaffold complex, we employ DPSCs to colonize two commercial 3D scaffolds: an experimental extracellular matrix preparation (Matrigel™) and a collagen sponge already used in surgery to improve tissue regeneration or cicatrisation. DPSCs seeded in these scaffolds were committed toward osteogenic lineage in vitro and the degree of differentiation degree and the production of calcified matrix were than then evaluated.
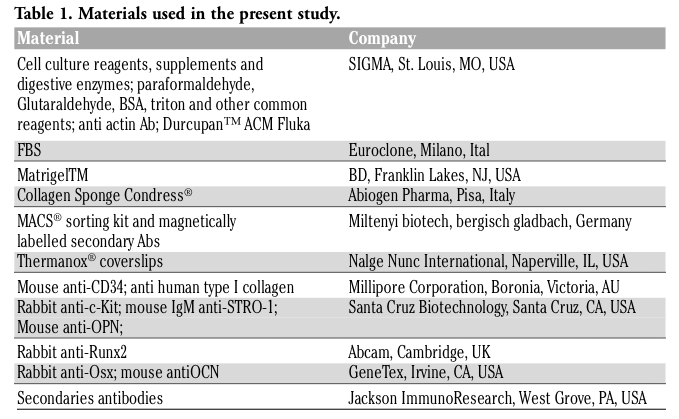
All the materials used in this study are listed in Table 1.
|
Table 1. Materials used in the present study. |
Cells were isolated from dental pulp as described in a previous study.8 Human dental pulp was extracted from third molar or permanent teeth of adult subjects (18 and 35 years of age) after informed consent of patients undergoing routine extractions. Dental pulp was removed from the teeth and then immersed in a digestive solution (3 mg/mL type I collagenase plus 4 mg/mL dispase in α-MEM) for 1 h at 37°C. Once digested, pulp was dissociated and then filtered onto 100 μm Falcon Cell Strainers to obtain a cell suspension. Cells were then plated in 25 cm2 flasks and cultured in culture medium (α-MEM added with 20% FBS, 100 μM 2P-ascorbic acid, 2 mM L-glutamine, 100 U/mL penicillin, 100 μg/mL streptomycin), at 37°C and 5% CO2. Cells obtained from a single dental pulp were plated at clonal density (1.6 cell/cm2). After 6 days of culture eight cell populations were isolated from nodules originated by single cells. Eight cell populations were isolated from nodules formed by cells obtained from a single dental pulp after 6 days of culture.
DPSCs were obtained by magnetic cell sorting using MACS® separation kit, according to the manufacturer instructions. Three successive sorting were performed by using specific antibodies against: CD34, a marker of stromal and haemopoietic pluripotent stem cells;15 c-Kit, the tirosin-kinase receptor of stem cells factor;16 STRO-1, an antigen present in a stromal cell population containing osteogenic precursors.17 These primary Abs were detected by magnetically labelled secondary Abs (anti-mouse IgG, anti-rabbit IgG and anti-mouse IgM). For each selection were used approximately 7x10⁶ cells were used. Firstly, pulp cell suspension was sorted by anti-CD34 Ab. CD34+ cells were expanded and then sorted by using anti-c-Kit Ab to obtain a CD34+/c-Kit+ population. In the same way the CD34+/c-Kit+ population was sorted by anti-STRO-1 Ab to obtain the CD34+/c-Kit+STRO-1+ population, that represents isolated DPSCs.
The expression of the CD34, c-Kit and STRO-1 antigens was analyzed by indirect staining using mouse anti-CD34 IgG, rabbit anti-c-Kit IgG and mouse anti-STRO-1 IgM, followed by sheep anti-mouse-FITC, goat anti-rabbit-FITC; and goat anti-mouseIgM-FITC. Non-specific fluorescence was assessed by using normal mouse IgG or IgM followed by the secondary antibody as described above. Analyses were performed with a EPICS XL flow cytometer (Beckman Coulter, Brea, CA, USA).
In order to obtain a differentiation into osteoblast on 2D surface, DPSCs were seeded at approximately 3000 cells/cm2 on culture dishes in the osteogenic medium (α-MEM, supplemented with 10% FBS, 100 μM 2P-ascorbic acid, 2 mM L-glutamine, 100 U/mL penicillin and 100 μg/mL streptomycin, 100 nM dexamethasone, 10 mM β-glycerophosphate). The medium was changed twice a week. Control DPSCs were cultured in the same medium without dexamethasone and β-glycerophosphate. For immunofluorescence experiments DPSCs were differentiated on Thermanox® plastic coverslips.
Cell counting was performed in control and in dDPSC of three independent experiments by a Nikon TE2000 inverted Microscope using a 10x objective and differential interference contrast (DIC). For each experimental point, the mean of cell number were calculated and cell density was expressed as cells/cm2.
Matrigel™ (Becton, Dickinson and Co.) and collagen sponge (Condress®, Abiogen Pharma) were used as 3D scaffolds in this study. Cells were seeded in both scaffolds in an adequate volume of medium to obtain a starting density of 1000 cell for mm3. For each sample cells were added to Matrigel™ at 4°C when it appears as liquid. A total volume of
400 μL of DPSCs-Matrigel™ was placed in a 12 multiwell plate in order to form a 1 mm thick layer which was polymerized at 37°C. DPSCs were injected in a 500 mm3 sample collagen sponge by a micropipette tip in different points to obtain a homogenous cell distribution. After 8 h from cells seeding, 2 mL of osteogenic medium was added to each sample. Medium changes were made twice a week.
Whole cell lysates were obtained from undifferentiated and differentiating DPSCs at different times of culture. Cells lysates were obtained as previously described.18 50 μg of protein (Badford assay) for each sample were separated by 10% or 15% SDS-page and then transferred to nitrocellulose membranes. The protocols of the western blot were performed as described by Sambrook et al.19 Blots were incubated overnight with one of the following Abs (diluted 1:1000 in TBS-T + 2% BSA and 3% milk): anti-CD34+, anti-c-Kit+, anti-STRO-1+, anti-Runx2, anti-OCN, anti-OPN and anti-Osx. Membranes were next incubated with peroxidase-labelled anti-rabbit, anti-mouse or anti-goat secondary abs diluted 1:5000, for 30 min at room temperature. All membranes were visualized using ECL (enhanced chemioluminescence, Amersham, UK). Anti actin Ab was used as control of protein loading in timing experiments.
To detect secreted OCN (sOCN), each sample was cultured with 2.5 mL of medium. Two mL of medium were collected for each sample at the same time-point and then precipitated in 10% Trichloroacetic acid (TCA). Precipitated proteins were re-suspended in 0.1N NaOH in H2O and then in Sample Buffer. The whole protein amount obtained for each sample was loaded in the SDS-page in order to have as a unique variable proteins secreted from dDPSCs.
Densitometry was performed on Western blot (WB) from three independent experiments by NIS software (Nikon, Tokio, Japan). An equal area (AOI) was selected inside each band and the mean of gray levels (in a 0-256 scale) was calculated. Data were then normalized to values of background and of control actin band.
Samples of 2D or 3D cultures were fixed in 4% Paraformaldehyde in phosphate buffered saline (PBS) at pH: 7.4 for 15-60 min and then processed for successive steps. Cells differentiated on coverslides were processed for immunofluorescence or histological staining. Matrigel samples were in toto processed, while collagen samples were processed to obtain
10 μm thick cryosections. Routine haematoxylin and eosin staining was performed on some samples to analyze morphological details. For Alizarin red staining, fixed cells (or cryosections) were incubated for 30 min at room temperature in a solution containing 0.1% alizarin red and 1% ammonium hydroxide. Counterstaining with fast green was also performed to visualize cell morphology. Images of histological samples were obtained by a Zeiss Axiophot microscope (Zeiss AG, Jena, Germany), equipped with a Nikon DS-5Mc CCD colour camera.
Fixed monolayer cells and in toto Matrigel™ samples were permeabilized respectively with 0.1% and 1% Triton X-100 in PBS for 10 min. Permeabilized samples and cryosections were then blocked with 3% BSA in PBS for 30 min at room temperature and incubated with the primary antibodies diluted in PBS containing 3% BSA (rabbit anti-c-Kit, mouse anti-CD34, mouse IgM anti-STRO-1; rabbit anti-Runx2; mouse anti-OPN; rabbit anti-Osx; mouse antiOCN) diluted 1:50 for 1 h at RT. After washing in PBS containing 3% BSA, the samples were incubated for 1 h at room temperature with the secondary Abs diluted 1:200 in PBS containing 3% BSA (donkey anti-rabbit-AMCA; sheep anti-mouse-FITC, and goat anti-mouseIgM-Cy5™; donkey anti rabbit-Cy3™). After washing in PBS, samples were stained with 1 μg/mL DAPI in H2O for 1 min (not performed in samples treated with donkey anti-rabbit-AMCA Ab) and then mounted with anti-fading medium (0.21 M DABCO and 90% glycerol in 0.02 M Tris, pH 8.0). Negative controls consisted of samples not incubated with the primary antibody. The multi-labelling immunofluorescence experiments were carried out avoiding cross-reactions between primary and secondary antibodies.
Fluorescent samples were observed by a Nikon TE2000 microscope equipped with a CCD camera Hamamatsu ORCA 285. Images were captured and processed by NIS software (Nikon, Tokio, Japan). Confocal imaging was performed on a Leica TCS SP2 AOBS confocal laser-scanning microscope as described by Maraldi et al.20 The confocal serial sections were processed with the Leica LCS software to obtain three-dimensional projections. Projections from each signal were processed as previously described.21 The image rendering was performed by Adobe Photoshop software.
Samples processed for morphology observations were fixed in 2.5% glutaraldehyde in Phosphate buffer (pH: 7.4) for 1 h and post-fixed in 1% OsO4 for 1 h. Ultrathin sections, obtained from Durcupan embedded samples, were stained with uranyl acetate-lead citrate and then observed by with a Zeiss EM109 Transmission Electron Microscope (Zeiss AG, Jena, Germany). Immunogold experiments were performed as described in a previous study.22 Briefly, samples were fixed in 1% glutaraldehyde in Phosphate buffer (pH 7.4) for 1 h, dehydrated in ethyl alcohol (50%, 70%, 90%, 95% and 100%), diaphanized in propylene oxide and embedded in Durcupan resin. Human collagen was detected, in ultrathin sections, by a mouse anti-human type I collagen Ab revealed by a 10 nm gold labelled anti-mouse Ab. Immunogold experiments were performed as previously described22 using a mouse anti-human type I collagen primary Ab detected by a 10 nm gold labelled anti-mouse Ab.
Quantitative or semi-quantitative data were expressed as mean ± standard deviation (SD). Differences between two experimental points or between experiments were evaluated by Student's t-test. In all analyses, values of P<0.05 were considered a significant statistical difference, while values of P<0.01 were considered a significant statistical difference.
The cells obtained from dental pulp by enzymatic digestion were cultured for several days to isolate DPSCs. The eight cell populations isolated from nodules, as reported in Materials and methods section, produce calcified matrix when maintained in osteogenic medium (data not shown). Flow cytometry analysis of these cell populations (Figure 1A) shows that the percentages of c-Kit+, CD34+ and STRO-1+ cells are 64%, 46% and 98% respectively (mean values), indicating that the majority of nodule constituting cells express c-Kit, CD34 and STRO-1 and then can be considered the SBP-DPSCs sub-population isolated by Laino et al.23
To improve the percentage of cells expressing c-Kit, CD34 and STRO-1, DPSCs were isolated from other cell types by MACS technology. To verify if sorted cells are c-Kit+, CD34+ and STRO-1+, flow cytometry and triple immunofluorescence experiments were performed on selected cells, by using specific antibodies (Figure 1). Flow cytometry demonstrates that MACS sorting improves the percentage of CD34+ (plus 20%) and c-Kit+(plus 34%) cells (Figure 1B). Immunofluorescence analysis shows that most of the sorted cells are simultaneously positive to the three antigens (Figure 1C: Blue for c-Kit, Green for CD34, Red for STRO-1). Each positive cell shows a diffuse labelling on the plasma membrane with the three signals appearing mostly as separate pixels and not showing without overlap or co-localization. Only a small number of few spots show the co-presence of two signals probably due to clusterization of receptors. The Ab specificity was confirmed by WB experiments (Figure 1D).
|
Figure 1. DPSCs selection. A: Diagram representing the percentage of c-Kit, CD34 and STRO-1 positive cells in eight different DPC colonies derived from clonal density plated cells. B: Flow cytofluorimetric analysis of DPSCs sorted by MACS. The percentage of positive cells is indicated. C: Fluorescence image of DPSCs triple labelled by anti c-Kit (Blue), anti-CD34 (green) and anti-STRO-1 (Red) Abs. Scale bar: 10 mm. D: Western blot analysis of whole cell lysates of sorted DPSC by anti c-Kit, anti-CD34 and anti-STRO-1 Abs. Arrows indicate the specific bands. |
In order to obtain osteogenic differentiation, DPSCs were plated on a plastic surface at the density of 3000 cell/cm2 and then cultured in osteogenic medium for up to 40 days. Osteogenic differentiation was evaluated by morphological, biochemical and immunocytochemical methods. DPSCs treated with culture medium alone represented control cells.
The differentiating cultures and control cells were observed by phase contrast microscopy to evaluate the morphological changes and the proliferation rate (Figure 2). Seeded cells show a fibroblast-like morphology (Figure 2A), proliferate and reach the confluence as monolayer at day 8 in both differentiating and control cultures. At this time dDPSC (Figure 2E) show a lower cell density and present a more extended cytoplasm (Figure 2B). After day 8 control cells proliferate actively and form overlapped layers that become evident at days 24 and 40 (Figure 2 C,D). On the contrary, differentiated cells are characterized by a lower proliferation activity and start to form nodular aggregates at day 24 (Figure 2F and inset). At day 40, in differentiated cultures, mineral deposits appear in the extracellular space and in nodular aggregates (Figure 2 G, H). Cell counting indicates that both differentiating and control cells present the same proliferation rate until day 8. Then undifferentiated DPSCs continue to grown exponentially and at day 40 reach a density of over 150,000 cells/cm2. On the contrary differentiating cells show a lower proliferation activity until day 24. After this time the number of dDPSC slightly decreases (Figure 2I).
To verify the commitment and differentiation of DPSCs into osteoblast-like cells, the presence of specific markers, such as Runx2, Osx, OPN and OCN, was analyzed by WB in whole cell lysates of dDPSC. A densitometric analysis was carried out on the WB bands to obtain a semi-quantitative analysis of the protein amount (Figure 3 A,B). Runx2 is detectable in all the experimental time points but presents significant expression peaks. The two major peaks occur at days 8-16, indicating the starting of DPSCs differentiation, and a third peak is evident at day 32. Runx2 amount decreases at days 24 and 40 suggesting a down-regulation of this protein. Osx is weakly present at day 16 and then increases showing two expression peaks at days 24-32, while at day 40 the protein level slightly decreases. OPN is expressed from day 8 to the end of the experiment, reaching an expression peak at day 16 and decreasing progressively until day 40. OCN is detectable during DPSC osteogenic differentiation both in cell lysates and in culture medium, as secreted protein (sOCN). This protein is significantly expressed in whole lysates from day 16 and shows a peak at day 40 (Figure 3 A,B). In culture medium, sOCN starts to be present at day 16, increases at day 24, then decreases at day 32 and reaches the highest level at day 40 (Figure 3C).
Western blot experiments were confirmed by immunofluorescence analysis. Double immunofluorescence labelling was carried out to analyze simultaneously the localization of OPN and Runx2 in dDPSC (Figure 4 A,F). The distribution of OCN and Osx (Figure 4 G,L) was observed in the same manner. During DPSCs osteogenic differentiation OPN is localized in the cytoplasm, above all in the perinuclear region that normally contains the RER (Figure 4 A,C,E; green signal). Runx2 is localized in the cell nucleus, as demonstrated by the overlapping with DAPI signal, and presents the nucleoplasmic distribution typical of transcription factors can be observed (Figure 4 B,D,F and insets; DAPI, blue signal; Runx2, red signal). At day 8 it is present approximately in all cell nuclei, while at day 24, when a strong decrease was observed by WB, it is mainly expressed in nodular aggregates, and nuclei of monolayered cells show a lower labelling. At day 40 Runx-2 appears heterogenically expressed at low levels only by some cells (Figure 4 A,F; red signal). Immunofluorescence analysis using anti-OCN and anti-Osx Abs also confirm WB data. OCN shows typical cytoplasmic localization with a pattern compatible with the distribution of RER (Figure 4 G,I,K, green signal). Similarly to Runx2, Osx shows a nucleoplasmic localization (Figure 4 H,J,L and insets). It is interesting to note that the signals from two proteins increase significantly at days 24 and 40 (Figure 4 I,L) and that nodular aggregates are more labelled than cells of surrounding monolayer (Figure 4 I,J). At day 41 we observe significant changes of cell morphology with evident cellular process typical of differentiating osteoblasts (Figure 4 E,K).
In order to verify if dDPSC are able to produce calcified matrix, cells were stained with alizarin red and counterstained with fast green, to evidence cell morphology. The presence of calcium deposits becomes evident after 40 days of culture (Figure 4 M,N) when nodular aggregates appear stained in red/orange. It is interesting to note that cells entrapped in calcium deposits show an osteocyte-like morphology (Figure 4M and inset).
|
Figure 2. Growth dynamics of undifferentiated and dDPSC. Phase contrast images of control DPSCs grown in culture medium alone at 0 (A), 8 (B), 24 (C) and 40 (D) days or maintained in osteogenic medium for 8 (E), 24 (F) and 40 (G, H) days. Scale bar: 200 μm. I: diagram representing the proliferation rate of both undifferentiated and dDPSC. Data were calculated by three independent experiments and presented as the mean ±SD of cell number for cm2. *P<0.01. |
|
Figure 3. Expression pattern of dDPSC. Western blot (WB) analysis (A) and densitometry (B) of Runx2, Osx, OPN and OCN expression in whole lysates of DPSCs at different time points of culture. Actin bands demonstrate that an equal amount of protein was loaded in each line. C: WB and densitometry of OCN released in culture medium. Values, calculated on three independent experiments, are expressed as mean (±SD) of gray levels of a 0-256 scale. *P<0.01; §P<0.05. |
|
Figure 4. Immunofluorescence and histochemical analysis of dDPSC. A-F: Triple fluorescence images showing signals from anti-OPN (green), anti-Runx2 (Red) and DAPI (Blue) of dDPSC at 8 (A,B), 24 (C,D) and 40 (E,F) days of culture. The superimposing between OPN and Runx2 signals is given in A, C, E while the overlap between Runx2 and DAPI signals is given in B, D, F and insets (3x magnification respect to B, D and F). G-L: Triple fluorescence images showing signals from anti-OCN (green), anti-Osx (Red) and DAPI (Blue) of dDPSC at 8 (G,H), 24 (I,J) and 40 (K,L) days of culture. The superimposing between OCN and Osx signals is given in G, I, K while the overlap between Osx and DAPI signals is given in H, J, L and insets (3x magnification respect to H, J and L). M-N: images of 40 days cultured DPSCs stained with Alizarin red and Fast Green (inset in M is a 2x magnification respect to M). Scale bar: 20 μm. |
To evaluate DPSCs differentiation in 3D scaffolds, cells were cultured and differentiated in two commercial devices: i) BD Matrigel, a solubilized extracellular matrix preparation extracted from the Engelbreth-Holm-Swarm (EHS) mouse sarcoma; ii) Collagen Sponge, a biomaterial made of insoluble equine type I collagen, already used in clinical practice as scaffold to support bone regeneration. Cells were seeded in both scaffolds at the density of 1000 cell/mm3 and treated for osteogenic differentiation for up to 40 days. Cell growth and osteogenic differentiation were evaluated at day 40, by histological, immunocytochemical and ultrastructural methods.
DPSCs seeded into Matrigel appear distributed in all the volume of the sample, they grow actively during the first week and form numerous cellular aggregates distributed homogeneously throughout the culture plate (Figure 5A). Each cellular aggregate, composed of cells with spindly-type morphology, shows a core with a higher cell density than the marginal area. The peripheral cells are in contact with cells of the near aggregates and probably interact, forming a cellular network (Figure 5B). Confocal analysis of immunofluorescence experiments with anti-OPN and anti-OCN Abs shows that cells of nodular aggregates express the two proteins after 40 days of culture (Figure 5 C,D) indicating that DPSCs are differentiating in osteogenic lineage. The alizarin staining of 40-day samples shows that nodular aggregates contain calcium deposits localized in the matrix close to the cells (Figure 5 E,F). TEM analysis of dDPSC cultured in Matrigel demonstrates that peripheral cells of nodular aggregates are connected by junctions probably classifiable as gap-type (Figure 5 G,H).
H&E staining shows that DPSCs colonize collagen scaffold, penetrating into the sponge and proliferating three-dimensionally. Cells are not homogeneously distributed in the sponge thickness, showing a higher cell density in the superficial layer, that decreases progressively towards the centre of the sponge (Figure 5I). Superficial cells have a flattened morphology and form a thin compact layer of 4-5 cells. Cell morphology changes from the surface to the sponge centre and becomes progressively spindle-type with the cellular process typical of differentiating osteoblasts (Figure 5J). In the sponge aggregates of collagen fibres are visible, surrounded by cells resembling trabecular-like structures (Figure 5 I,J arrows).
Immunocytochemical evaluation of osteogenic differentiation shows that DPSCs growing in collagen sponge express both OPN and OCN osteogenic markers. OPN is strongly expressed by DPSCs localized in superficial layers and is less present in the inner ones (Figure 5K). Cells positive to OPN Ab are strictly adherent to collagen fibres associated in trabecular-like structures, as also observed by H&E staining (arrows). DPSCs localized in inner layer, presenting an osteoblast-like morphology or localized near trabecular-like structures, express higher levels of OCN with respect to superficial cells (Figure 5L).
Alizarin Red staining shows that calcium deposits are present in the whole sponge thickness and much more in trabecular-like structures (Figure 5 M,N).
TEM analysis of dDPSC cultured in collagen sponge demonstrates that cells are inter-connected by gap junction as described for Matrigel (not shown). The assembling of neo-synthesized tropo-collagen molecules in collagen sub-microscopic fibrils is well visible both in sagittal and in transversal sections (Figure 6 A,B). To verify if sub-microscopic fibrils are effectively secreted by dDPSC, immunogold experiments with anti Human collagen I Ab were carried out. This Ab recognizes collagen I of Human origin but it does not react with the equine type I collagen of the sponge (Figure 6 C,D). Immunogold experiments demonstrate that sub-microscopic fibrils are clearly labelled by anti-Human collagen I Ab (Figure 6D, arrows). On the opposite, equine collagen fibres of the sponge are not labelled by anti Human collagen I Ab (Figure 6D, arrow head).
|
Figure 5. Microscopical analysis of DPSCs cultured in 3D scaffolds. A-H: In toto images of a 1 mm thick Matrigel layer in which DPSCs was cultured for 40 days. Stereomicroscopical images are shown in A and B. Confocal images of fluorescence signals from anti-OPN and anti-OCN Abs superimposed with DAPI signal are given in C and D respectively. Alizarin Red staining is shown in E and F. TEM images of a probable gap junction between two dDPSC is shown in G-H (H represent a magnification of G). I-N: 10 μm thick cryosections images of Collagen scaffolds colonized with dDPSC. H&E images are shown in I and J. Confocal images of fluorescence signals from anti-OPN and anti-OCN Abs superimposed with DAPI signal are given in K and L respectively. Arrows in I-K indicate a trabecular-like structure surrounded by cells. Alizarin Red staining is shown in M and N. A-B: scale bar: 2 mm. C-F and I-N: scale bar: 100 μm. G-H: scale bar: 0.5 μm. |
|
Figure 6. Ultrastructural analysis of DPSCs cultured in Collagen scaffolds. A-B: Morphological features of dDPSC in collagen sponge; tropocollagen assembling is shown in A (sagittal section of sub-microscopic fibrils) and B (transversal section of sub-microscopic fibrils). C-D: Immuno-gold analysis of dDPSC by anti-Human Collagen I Ab. D represents a magnification of C. In D arrows indicate sub-microscopic fibrils labelled by anti anti-Human Collagen I Ab (gold particles); arrow head indicates equine collagen fibres of the sponge not labelled by immunogold reaction. Scale bar: 0.5 μm. |
In this study we analyze the osteogenic differentiation features of DPSCs in vitro cultured on 2D surface and in 3D scaffolds. DPSCs population isolated from dental pulp of adults’ teeth present in their membrane the c-Kit, CD34 and STRO-1 antigens and then coincides with the DPSC sub-population (SBP-DPSCs) described by Laino et al.23 According to data previously described, osteogenic differentiation of DPSCs was obtained by treatment with dexamethasone to stimulate cell differentiation, ascorbic acid to stimulate extracellular matrix synthesis and β-glycerophosphate to promotes ECM mineralization.4,24 DPSCs respond to this osteogenic condition with a strong decrease of proliferation after day 8 of culture, when the confluence was reached. After this point control cells proliferate actively forming overlapped layers while dDPSC grow as monolayer and form typical mineral deposits and nodules described by other authors.23 After day 24, the number of dDPSC shows a slightly reduction probably due to increase of cell death that normally occur during late cell differentiation.
To verify if morphological observation really indicates a DPSC osteogenic differentiation we investigated in dDPSC the expression of bone related proteins. Recently Yu and co-workers demonstrated that STRO-1+ DPSCs can only differentiate in osteogenic lineage, after the 9th passage, expressing specific markers.25 Different transcription factors and proteins typical of bone ECM are expressed during osteoblast differentiation. Only a small number of these can be used as stringent markers because they are clearly expressed in bone tissue or show typical expression peaks during osteoblast differentiation. The DPSCs osteogenic differentiation observed in our experiments can be distinguished in two phases on the basis of expression of specific markers like Runx2, Osx, OPN and OCN. The first phase from day 0 to day 16 is characterized by a strong expression of Runx2 coupled with a greater presence of OPN. Runx2 is in fact expressed in undifferentiated cells but shows a considerable increase between 8 and 16 days, that coincides with the proliferation decrease and presumably with the starting of a late differentiation phase. OPN shows its maximum expression level at day 16 in coincidence with Runx2 peak and then decreases progressively to the end of culture. These observations indicate that this phase represents an early stage of osteogenic differentiation according to data that describes high levels of Runx2 and OPN in immature osteoblasts.26 The proliferation decrease observed in this early phase is consistent with the role of Runx2 that acts as a negative modulator of osteoblast proliferation.27 In the second phase, from day 16 to day 40, dDPSC show a low proliferation rate and express a higher amount of Osx maintained until day 32. The increase of Osx occurring after Runx2 peaks is consistent with data describing Osx positively, governed by Runx2 during osteoblast differentiation.10,26 In this phase the regular increase of intracellular OCN levels and the marked presence of sOCN in culture medium indicate that dDPSCs undergo a late differentiation phase characterized by an ECM maturation process. Previous data indicate that OCN is the most specific marker of late osteoblast differentiation because it is synthesized only by mature osteoblasts at the end of matrix maturation process.28,29 The OPN decrease observed in this phase was supported by observations demonstrating the presence of OPN during osteoblast differentiation and its progressive down-regulation according to its role of mineralization inhibitor.24,30 In our model, after the first induction, started by the first Runx2 peaks, other osteogenic inductions can be promoted by following Runx2 peaks in order to maintain an immature sub-population of dDPSC that undergo further terminal differentiation events. On the other hand immunofluorescence data indicate that the decrease of Runx2, observed by WB at day 24, occurs in the majority of dDPSCs while its expression is maintained in cells of nodular aggregates. In contrast Osx and OCN at day 24 are expressed both in nodular aggregates and in monolayer cells. Successively their presence characterizes almost the entire cell population. This data suggest that nodular aggregates are contemporaneously composed of a sub-population of immature dDPSC and by a dDPSC population that progressively undergo to terminal differentiation. The change of cell morphology at day 40, characterized by thin and long cellular process, indicates that dDPSCs are in a very late differentiation phase. Moreover, Alizarin Red staining demonstrates that calcified ECM was produced and in some cases dDPSCs are entrapped by this and show osteocyte-like morphology.
An optimal bone formation requires that osteoblasts grow and differentiate in a three-dimensional (3D) environment, allowing the formation of an intercellular network. Previous studies indicate that osteogenic differentiation is improved by culture in 3D scaffolds that mime the physiological condition.31,32,33 Calcified tissue can be produced in vitro using bone marrow MSC cultured on collagen sponge or similar bio-scaffolds, already utilized in surgery to support and improve bone regeneration.34,35,36,37 Our data obtained by culturing DPSCs on Matrigel™ and Collagen sponge indicate that both scaffolds optimize DPSCs growing and differentiation. The gelatinous structure of Matrigel mimes the amorphous extracellular matrix components (proteoglycans and GAG) and allows DPSC to grow forming three-dimensional nodules. TEM analysis demonstrates that peripheral cells of these nodules are interconnected by gap junction analogously to osteocyte network observed in bone tissue.38,39 A better result was obtained with collagen sponge because DPSCs colonize this scaffold with a distribution that mimes the bone histology. Cells of superficial layers are less differentiated as demonstrated by the clear expression of OPN that decreases in the inner layers. Moreover these cells present a very flat morphology and form a thin superficial layer that can be compared with the bone periosteum. Cells with osteoblast-like morphology that, unlike superficial cells, express high levels of OCN (late differentiation marker) and actively neo-synthesize human collagen, are present in the inner layers. In this region structures containing dense collagen fibres and calcified matrix that resemble bone trabeculae, were detectable.
In this study we demonstrated that DPSCs are able to differentiate in osteogenic lineage both in 2D and 3D surfaces, creating osteoblast-like cells that express specific osteogenic markers and produce mineralized ECM. The combination with 3D bioscaffolds was performed in order to produce a dDPSC-bioscaffold device that can be easily inserted by the surgeon during surgical intervention in order to repair any bone tissue deficiency. This tissue engineering approach could be a promising tool to restore bone defects and deficiencies that currently are treated surgically through the application of artificial permanent implants. In particular the in vitro bone production from stem cells may represent a radical breakthrough in the treatment of congenital or acquired pathologies and secondary traumas characterized by critical bone mass defects, which even today resist any medical or surgical solution. In addition DPSCs can also be used to colonize prosthesis and orthodontic implants in order to optimize the osteo-integration and the efficiency of the implant itself.
1. Hombach-Klonisch S, Panigrahi S, Rashedi I, Seifert A, Alberti E, Pocar P, et al. Adult stem cells and their trans-differentiation potential-perspectives and therapeutic applications. J Mol Med 2008;86: 1301-14. [PubMed]
2. Gronthos S, Mankani M, Brahim J, Robey PG, Shi S. Postnatal human dental pulp stem cells (DPSCs) in vitro and in vivo. Proc Natl Acad Sci USA 2000;97:13625-30.[PubMed]
3. Gronthos S, Brahim J, Li W, Fisher LW, Cherman N, Boyde A, et al. Stem cell properties of human dental pulp stem cells. J Dent Res 2002;81:531-5.[PubMed]
4. Zhang W, Walboomers XF, Shi S, Fan M, Jansen JA. Multilineage differentiation potential of stem cells derived from human dental pulp after cryopreservation. Tissue Eng 2006;12:2813-23.[PubMed]
5. Arthur A, Rychkov G, Shi S, Koblar SA, Gronthos S. Adult human dental pulp stem cells differentiate toward functionally active neurons under appropriate environmental cues. Stem Cells 2008;26:1787-95.[PubMed]
6. Graziano A, D'Aquino R, Laino G, Papaccio G. Dental pulp stem cells: a promising tool for bone regeneration. Stem Cell Rev 2008;4:21-6.[PubMed]
7. Graziano A, D'Aquino R, Laino G, Proto A, Giuliano MT, Pirozzi G, et al. Human CD34+ stem cells produce bone nodules in vivo. Cell Prolif 2008;41:1-11.[PubMed]
8. Laino G, Graziano A, D'Aquino R, Pirozzi G, Lanza V, Valiante S, et al. An approachable human adult stem cell source for hard-tissue engineering. J Cell Physiol 2006;206:693-701.[PubMed]
9. Nakashima K, Zhou X, Kunkel G, Zhang Z, Deng JM, Behringer RR, et al. The novel zinc finger-containing transcription factor osterix is required for osteoblast differentiation and bone formation. Cell 2002;108: 17-29.[PubMed]
10. Marie PJ. Transcription factors controlling osteoblastogenesis. Arch Biochem Biophys 2008;473:98-105. [PubMed]
11. Zhao Y, Wang C, Li S, Song H, Wei F, Pan K, et al. Expression of Osterix in mechanical stress-induced osteogenic differentiation of periodontal ligament cells in vitro. Eur J Oral Sci 2008;116:199-206.[PubMed]
12. Butler WT. The nature and significance of osteopontin. Connect Tissue Res 1989;23: 123-36.[PubMed]
13. Nanci A, Wazen R, Nishio C, Zalzal SF. Immunocytochemistry of matrix proteins in calcified tissues: functional biochemistry on section. Eur J Histochem 2008;52: 201-14. [FullText]
14. Roach HI. Why does bone matrix contain non-collagenous proteins? The possible roles of osteocalcin, osteonectin, osteopontin and bone sialoprotein in bone mineralisation and resorption. Cell Biol Int 1994;18:617-28. [PubMed]
15. Simmons PJ, Torok-Storb B. CD34 expression by stromal precursors in normal human adult bone marrow. Blood 1991; 78:2848-53. [PubMed]
16. Barclay AN, Jackson DI, Willis AC, Williams AF. The leukocyte-common antigen (L-CA) family. Adv Exp Med Biol 1988; 237:3-7.[PubMed]
17. Gronthos S, Graves SE, Ohta S, Simmons PJ. The STRO-1+ fraction of adult human bone marrow contains the osteogenic precursors. Blood 1994;84:4164-73.[PubMed]
18. Sena P, Riccio M, Marzona L, Nicoli A, Marsella T, Marmiroli S, et al. Human MATER localization in specific cell domains of oocytes and follicular cells. Reprod Biomed Online 2009;18:226-34.[PubMed]
19. Sambrook J, Fritsch EF, Maniatis T. Molecular Cloning: A Laboratory Manual. 2nd ed. 1989. Cold Spring Harbor Lab. Press, Cold Spring Harbor, NY, USA.
20. Maraldi T, Riccio M, Sena P, Marzona L, Nicoli A, La Marca A, et al. MATER protein as substrate of PKCepsilon in human cumulus cells. Mol Hum Reprod 2009;15: 499-506. [PubMed]
21. Riccio M, Resca E, Bertoni L, Cavani F, Sena P, Ferretti M, et al. RGB method in immunofluorescence investigations on stem cells. Optics & Laser Technology 2010;43:317-22. [Abstract]
22. Riccio M, Di Giaimo R, Pianetti S, Palmieri PP, Melli M, Santi S. Nuclear Localization of Cystatin B, the Cathepsin Inhibitor Implicated in Myoclonus Epilepsy (EPM1). Exp Cell Res 2001;262: 84-94. [PubMed]
23. Laino G, D'Aquino R, Graziano A, Lanza V, Carinci F, Naro F, et al. A new population of human adult dental pulp stem cells: a useful source of living autologous fibrous bone tissue (LAB). J Bone Miner Res 2005;20:1394-402.[PubMed]
24. Kärner E, Bäckesjö CM, Cedervall J, Sugars RV, Ahrlund-Richter L, Wendel M. Dynamics of gene expression during bone matrix formation in osteogenic cultures derived from human embryonic stem cells in vitro. Biochim Biophys Acta 2008;1790: 110-8.[PubMed]
25. Yu J, He H, Tang C, Zhang G, Li Y, Wang R, et al. Differentiation potential of STRO-1+ dental pulp stem cells changes during cell passaging. BMC Cell Biol 2010;8:11-32.[PubMed]
26. Komori T. Regulation of osteoblast differentiation by transcription factors. J Cell Biochem 2006;99:1233-9.[PubMed]
27. Pratap J, Galindo M, Zaidi SK, Vradii D, Bhat BM, Robinson JA, et al. Cell growth regulatory role of Runx2 during proliferative expansion of preosteoblasts. Cancer Res 2003;63:5357-62. [PubMed]
28. Sila-Asna M, Bunyaratvej A, Maeda S, Kitaguchi H, Bunyaratavej N. Osteoblast differentiation and bone formation gene expression in strontium-inducing bone marrow mesenchymal stem cell. Kobe J Med Sci 2007;53:25-35. [PubMed]
29. Valenti MT, Dalle Carbonare L, Donatelli L, Bertoldo F, Zanatta M, Lo Cascio V. Gene expression analysis in osteoblastic differentiation from peripheral blood mesenchymal stem cells. Bone 2008;43:1084-92. [PubMed]
30. Hunter GK, Hauschka PV, Poole AR, Rosenberg LC, Goldberg HA. Nucleation and inhibition of hydroxyapatite formation by mineralized tissue proteins. Biochem J 1996;317:59-64. [PubMed]
31. Boukhechba F, Balaguer T, Michiels JF, Ackermann K, Quincey D, Bouler JM, et al. Human Primary Osteocyte Differentiation in a Three-Dimensional Culture System. J Bone Miner Res 2009;24:1927-35. [PubMed]
32. Ferrera, D, Biassoni C, Dickson GR, Astigiano S, Barbieri O, Favre A, et al. Three-dimensional cultures of normal human osteoblasts: proliferation and differentiation potential in vitro and upon ectopic implantation in nude mice. Bone 2002;30:718-25. [PubMed]
33. Kale S, Biermann S, Edwards C, Tarnowski C, Morris M, Long MW. Three-dimensional cellular development is essential for ex vivo formation of human bone. Nat Biotechnol 2000;18:954-8. [PubMed]
34. Gigante A, Manzotti S, Bevilacqua C, Orciani M, Di Primio R, Mattioli-Belmonte M. Adult mesenchymal stem cells for bone and cartilage engineering: effect of scaffold materials. Eur J Histochem 2008;52: 169-74. [FullText]
35. Zavan B, Giorgi C, Bagnara GP, Vindigni V, Abatangelo G, Cortivo R. Osteogenic and chondrogenic differentiation: comparison of human and rat bone marrow mesenchymal stem cells cultured into polymeric scaffolds. Eur J Histochem 2007;51:1-8. [PubMed]
36. Donzelli E, Salvadè A, Mimo P, Viganò M, Morrone M, Papagna R, et al. Mesenchymal stem cells cultured on a collagen scaffold: In vitro osteogenic differentiation. Arch Oral Biol 2007;52:64-73. [PubMed]
37. Jäger M, Feser T, Denck H, Krauspe R. Proliferation and osteogenic differentiation of mesenchymal stem cells cultured onto three different polymers in vitro. Ann Biomed Eng 2005;33:1319-32. [PubMed]
38. Civitelli R. Cell-cell communication in the osteoblast/osteocyte lineage. Arch Biochem Biophys 2008;473:188-92.[PubMed]
39. Palumbo C, Ferretti M, Marotti G. Osteocyte dendrogenesis in static and dynamic bone formation: an ultrastructural study. Anat Rec A Discov Mol Cell Evol Biol 2004;278:474-80. [PubMed]
[TOP]