F. Boschi, M. Fontanella, L. Calderan, A. Sbarbati
Department of Morphological-Biomedical Sciences, Section of Anatomy and Histology, University of Verona, Italy
Correspondence: Federico Boschi, Department of Morphological-Biomedical Sciences, Section of Anatomy and Histology, University of Verona, strada Le Grazie 8, 37134 Verona, Italy.
Tel. +39.045.8027155 - Fax: +39.045.8027163.
E-mail: federico.boschi@univr.it
Key words: optical imaging, essential oil, transdermal administration, fluorescence, phosphorescence, luminescence, in vivo.
Acknowledgements: the authors wish to thank Dr. Maria Paola Cecchini for the helpful discussions and the Fondazione Monte dei Paschi di Siena for the financial support.
Received for publication: 18 September 2010.
Accepted for publication: 6 May 2011.
This work is licensed under a Creative Commons Attribution 3.0 License (by-nc 3.0).
©Copyright F. Boschi et al., 2011
Licensee PAGEPress, Italy
European Journal of Histochemistry 2011; 55:e18
doi:10.4081/ejh.2011.e18
Abstract Essential oils are currently of great importance to pharmaceutical companies, cosmetics producers and manufacturers of veterinary products. They are found in perfumes, creams, bath products, and household cleaning substances, and are used for flavouring food and drinks. It is well known that some of them act on the respiratory apparatus. The increasing interest in optical imaging techniques and the development of related technologies have made possible the investigation of the optical properties of several compounds. Luminescent properties of essential oils have not been extensively investigated. We evaluated the luminescent and fluorescent emissions of several essential oils, in order to detect them in living organisms by exploiting their optical properties. Some fluorescent emission data were high enough to be detected in dermal treatments. Consequently, we demonstrated how the fluorescent signal can be monitored for at least three hours on the skin of living mice treated with wild chamomile oil. The results encourage development of this technique to investigate the properties of drugs and cosmetics containing essential oils. |
Essential oils are composed of different mixtures of organic compounds extracted from plants, having many biological activities.1 Most essential oils (55%), are used in the food industry for the production of aroma extracts, while 20% are used as fragrances in perfumery and cosmetics, or in pharmaceutical or natural products (5%); a consistent percentage of oils are separated into their component parts (15%) for various uses.2 Recently there has been a certain interest in their antibacterial and antifungal properties or antioxidant activities; some compounds have been isolated and their pharmaceutical behaviour studied.3,4,5,6,7,8
Essential oils are derived from as different families as Asteraceae, Apiaceae, Lauraceae, Pinaceae and others.9,10 They are usually produced by steam distillation, although extraction methods such as mechanical expression, solvent extraction or supercritical fluid extraction are also used.11,12 Essential oils are usually lipophilic and not soluble in water, but according to the composition and the production method they can be dissolved in alcohols; moreover they are often volatile compounds.13 Terpenoids, the main components of the oils, are synthesized from isoprene units and follow the chemical formula (C5H9-11)n. Mono- (n=2) and sesquiterpene s (n=3)14 are the most common compounds, followed by diterpenes (n=4) and aromatic compounds (phenols, benzenoids, flavonoids).15,16,17,18 The yield and the composition of products can be greatly influenced by plant organs (leaves, flowers, stems), as well by the ecosystem in which the plant is cultivated.19,20 Certainly, different species of the same gender could show different compositions (e.g. lavandula officinalis, lavandula lanata and lavandula stoechas), although the main components of terpenoid and phenolic fractions are similar.15,16,21,22
Concerning interactions with living systems, it is known that essential oils affect the respiratory system;1 it was recently shown, using Magnetic Resonance Imaging, that they can act on the physical properties of the mucus in rat airways.23,24 In recent years optical imaging techniques have been developed thanks to the technological evolution of light detectors, which allow the study of the optical properties of different compounds. One of the fundamental mechanisms of interaction between light and biological objects is luminescence, which is subdivided into fluorescence, corresponding to an allowed optical transition with a short (nanosecond) lifetime, as well as phosphorescence, corresponding to a forbidden transition with longer decay times.25 Fluorescence is a process in which the emission of light is induced by illumination of the subject.26 Phosphorescence may be an appropriate term to be used in the context of luminescence from organic compounds involving triplet-to-singlet transitions.27 According with the common use we refer here with luminescence to the radiative processes except for fluorescence. It is known that luminescence in plants is a response to stress and shocks;28,29 fluorescence may correlate with senescence30 and stress.31 However, the optical properties of essential oils have been subject to very little investigation. Although luminescence and fluorescence cannot furnish direct information about the chemical composition of essential oils, we supposed that they could be used to track the persistence and diffusion of drugs or cosmetics containing essential oils on the skin of treated living organisms. The aim of the present study was to investigate the luminescent properties of essential oils, and to see if they could be measured in living organisms. We were interested in transdermal administration, which mimics the diffusion of some drugs and of chemicals used in cosmetics. We investigated the luminescence of several essential oils (after exposure to normal ambient illumination and to sunshine) and their fluorescent emission. We also detected the fluorescent emission of wild chamomile oil from the skin of treated mice. This study was a proof of principle for research about the application of essential oils in vivo, and aimed to develop a new approach to the study of the effects of organic compounds in living organisms.
Fluorescence and luminescence images were acquired using VivoVision System IVIS® 200 (Xenogen Corporation, Alameda, CA, USA), made up of a camera sensor back thinned, back illuminated grade CCD 1 (2.7 x 2.7cm, 2048 x 2048 pixels, pixel dimension 13.5 µm, cooled at 90°C) and a 150W Quartz halogen 3250° Kelvin lamp. Images were acquired using Living Image 2.6 software (Xenogen Corporation).
Wild Chamomile, Lavender (named here Lavender 1), Marjoram, Melissa, Mentha, Oregano, Pine, Rosemary, and Tea Tree (purchased from Dolisos, Pomezia, RM, Italy), Lavender (named here Lavender 2) and Lemon (purchased from Just, Grezzana, VR, Italy) were tested. For each compound 300 μL were placed in a non-fluorescent 96 multiwell plate and imaged using the optical instrument.
Luminescent images of the compounds were acquired with the subsequent parameters: quartz halogen lamp off, field of view = 12.8x12.8 cm, f/stop = 1, binning factor = 16, exposure time = 5 or 10 min; no excitation or emission filters were used.
Essential oils were handled in a daylit laboratory with blinds and placed in the dark room of the instrument for 30 min before the first luminescence acquisition (pre); then, the samples were exposed to sunshine for 5 min, after which three luminescent images (post1, post2 and post3) with exposure times of 10 min were acquired consecutively.
Fluorescent images of the compounds were acquired with the subsequent parameters: quartz halogen lamp on, field of view = 12.8x12.8 cm, f/stop = 2, binning factor = 4, exposure time = 1 s; excitation filters GFP (445-490 nm), DsRed (500-550 nm), Cy5.5 (615-665 nm) and ICG (710-760 nm); emission filters: four wide-band filters GFP (515-575 nm), DsRed (575-650 nm), Cy5.5 (695-770 nm), ICG (810-875 nm) and six narrow band filters 560 nm (550-570 nm), 580 nm (570-590 nm), 600 nm (590-610 nm), 620 nm (610-630 nm), 640 nm (630-650 nm), 660 nm (650-670 nm). Essential oils were handled in a daylit laboratory with blinds and placed in the dark room of the instrument for 30 min before the fluorescent images were acquired.
For the in vivo acquisitions we used the subsequent parameters: quartz halogen lamp on, field of view = 12.8x12.8 cm, f/stop = 2, binning factor = 8, exposure time = 1 s; excitation filter GFP (445-490 nm); emission filters: GFP (515-575 nm) and DsRed (575-650 nm). Two adult female Balb-C mice were treated three times (at 18-min intervals) with 200 μL of wild chamomile oil. The oil was applied using a brush on the furless skin. The dose administered to the mice was arbitrarily chosen because no pertinent data was found in the literature. One other mouse was kept for control measurements. All the animals were put in prone position on the heated stage of the optical instrument. Chamomile oil is popular worldwide and frequently used in paediatrics against eczema and dry skin because of its anti-inflammatory and antiseptic properties.32 For more than two weeks before the experiment the animals had been fed an alfalfa-free diet to reduce tissue autofluorescence.33
The research was conducted in accordance with the regulations of the Italian Ministry of Health and to the European Communities Council (86/609/EEC) directives.
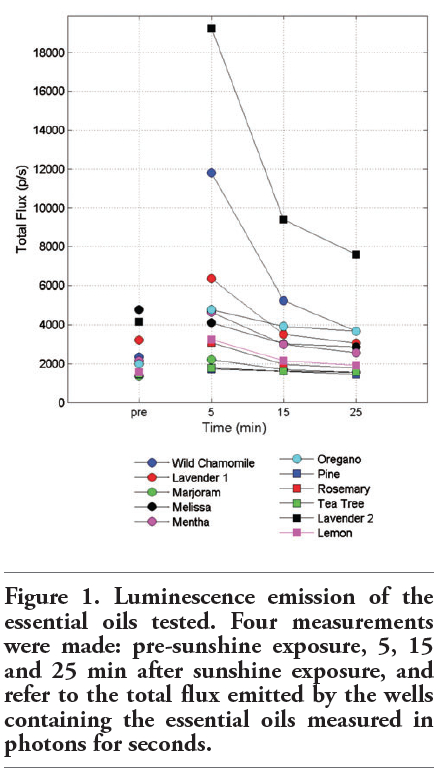
The data of the luminescent oil emissions are shown in Figure 1. In the pre sunshine acquisition we found that the flux emitted from the essential oils was in the range 1-5 103 p/s, with Melissa and Lavender 2 proving to be the most luminescent compounds. In the first image after sunshine exposure, almost all the essential oils showed an increase in emission, followed by a continuous decrease in the subsequent acquisitions. Lavender 2 and wild chamomile emitted the greatest signal intensity in all post images.
|
Figure 1. Luminescence emission of the essential oils tested. Four measurements were made: pre-sunshine exposure, 5, 15 and 25 min after sunshine exposure, and refer to the total flux emitted by the wells containing the essential oils measured in photons for seconds. |
The fluorescent emission measurements of the essential oils are shown in Figure 2. They are grouped on the basis of the excitation filters used. The measurements show efficiency of the signal that is the radiance of the subject divided by the illumination intensity.
When wide band filters were applied, all the essential oils showed the maximum emission with GFP excitation and GFP emission filters, or GFP excitation and DsRed emission filters. Excitation light with a longer wavelength than GFP produced lower fluorescent signal intensity. Using the GFP-GFP setup, the efficiency of all the compounds was in the range 0-6.5 10–5 p/s and the corresponding flux was in the range 0-1.4 109 p/s. The greatest signal intensity with the GFP-GFP setup was found with Lavender 2 and Wild Chamomile.
When narrow band emission filters were applied, all the essential oils presented a decrease of the signal from 560 nm to 660 nm.
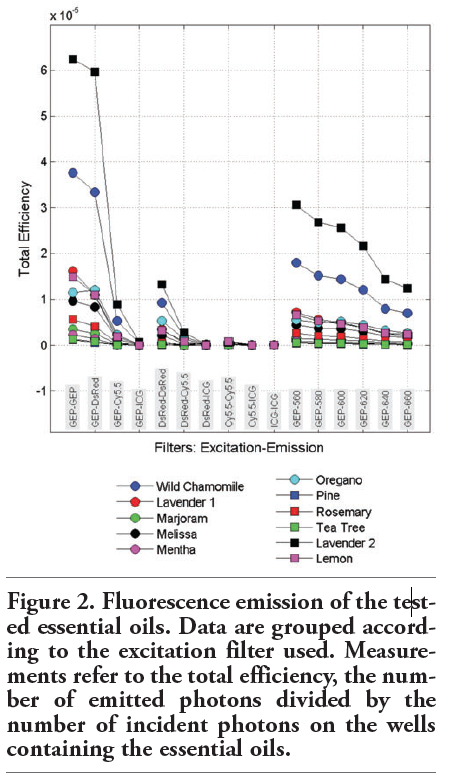 |
Figure 2. Fluorescence emission of the tested essential oils. Data are grouped according to the excitation filter used. Measurements refer to the total efficiency, the number of emitted photons divided by the number of incident photons on the wells containing the essential oils. |
The in vivo treatment with wild chamomile increased the emission coming from the skin of the animals compared to the pre treatment image. Particularly, in Figure 3, it is possible to compare the emission from the treated animals 3 h after the end of the treatment and the emission before treatment, with respect to the control animal.
The measurements of fluorescent emission from a region of interest (ROI) drawn on images and corresponding to the furless back of the mice are presented in Figure 4. The enhancement of the average efficiency (AF), defined as:
Enhancement = (AF(t)- AF(pre))/AF(pre)
where t is the time reported.
It is of major importance that all measurements relating to the treated animal group differ from the null value; these significant differences were due to the increasing fluorescent signal intensity after the treatment. After the 3rd administration a further increase in the fluorescent signal was visible. Three hours after the treatment end the signal was still evident on the surface of the animal’s skin.
Despite an alfalfa-free diet for more than two weeks before treatment, the autofluorescence of the animals was visible in the images; the fluorescent signal of the essential oil was detectable over the background emission. Figure 3 also shows that the fur is a source of fluorescence, as known in literature.33 This emission does not interfere with the measured emission because it originates out of the ROIs.
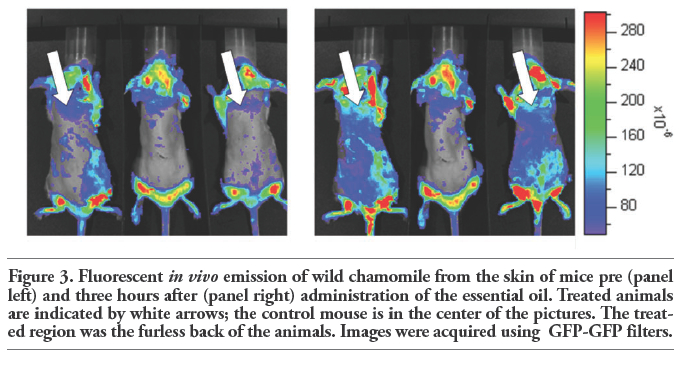 |
Figure 3. Fluorescent in vivo emission of wild chamomile from the skin of mice pre (panel left) and three hours after (panel right) administration of the essential oil. Treated animals are indicated by white arrows; the control mouse is in the center of the pictures. The treated region was the furless back of the animals. Images were acquired using GFP-GFP filters. |
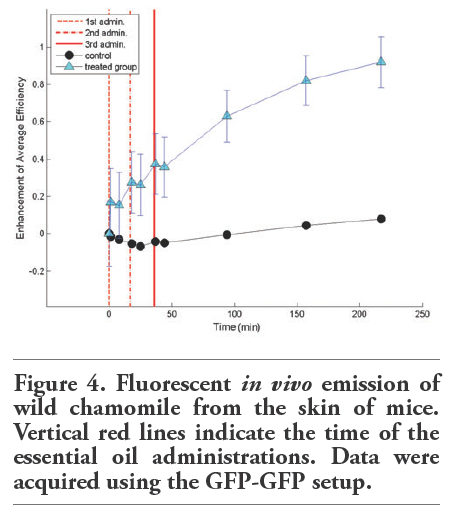 |
Figure 4. Fluorescent in vivo emission of wild chamomile from the skin of mice. Vertical red lines indicate the time of the essential oil administrations. Data were acquired using the GFP-GFP setup. |
The experimental data showed that some essential oils have luminescent properties. It might be interesting to extend this study, and investigate the possible dependence of phosphorescence emission on sunshine exposure. The incidence of uncontrolled external light was a problematic issue for the aim of this study.
The experiments also showed that some essential oils fluorescent properties can easily be detected with commercial optical instruments. Moreover, the measured flux in the case of fluorescence emission is several orders of magnitude greater than the flux emitted without an exciting source. So we believe that fluorescent properties are more suitable for the study of small living animals.
Differences in the intensities in luminescence and fluorescent emissions can be related to chemical composition: the main components of the extracted oils, terpenoids, are mixtures of cyclic and acyclic species with different degrees of conjugation.1,34 The composition of these mixtures (monoterpenes, sesquiterpenes and diterpenes) changes according to the plant and the method used for oil extraction.9,13 The differences observed between the two types of lavender oil, for example, could be explained by hypothesising the use of two different extraction processes, or of different species of the same plant.9,35,36 Therefore, the possible differences of the chemical composition of the different lots must be taken into account in future studies.
The in vivo experiments demonstrated that the fluorescent emission of Wild Camomille oil is detectable on the skin of animals for at least three hours after treatment. We would like to emphasise that occasionally the essential oil dripped from the shaved back of the animals to the fur. This could explain the increasing fluorescence emission of the untreated parts of the animals along the experimental time.
Our results encourage development and improvement of the imaging technique hereby described in the investigation of drugs and cosmetics to be administered transdermally to living organisms.
The present work lays the foundation for a real in vivo histochemistry. With the advantage of the non-invasiveness, the investigated method allows to evaluate tissue staining using the interaction with specific biomarkers
1. Bakkali F, Averbeck S, Averbeck D, Idaomar M. Biological effects of essential oils – A review. Food Chem Toxicol 2008;46:446-75.[CrossRef] [PubMed]
2. Pauli A. Anticandidal low molecular compounds from higher plants with special reference to compounds from essential oils. Med Res Rev 2006;26:223-68.[CrossRef] [PubMed]
3. Skold M, Hagwall L, Karlberg AT. Autoxidation of lynalil acetate, the main component of lavender oil, creates potent contact allergens. Contact Dermatitis 2008;58:9-14.[CrossRef] [PubMed]
4. Dastmalchi K, Dorman HJD, Oinonen PP, Darwis Y, Laakso I, Hiltunen R. Chemical composition and in vitro antioxydative activity of a lemon balm (Melissa officinalis L.) extract. LWT 2008;41:391-400.[CrossRef]
5. Angioni A, Barra A, Cereti E, Barile D, Coisson JD, Arlorio M, et al. Chemical composition, plant genetic differences, antimicrobial and antifungal activity investigation of the essential oil of Rosmarinus officinalis L. J Agric Food Chem 2004;52: 3530-5.[CrossRef] [PubMed]
6. Halcon L, Milkus K. Staphylococcus aureus and wounds: a review of tea tree oil as a promising antimicrobial. Am J Infect Control 2004;32:402-8.[CrossRef] [PubMed]
7. Costa S, Utan A, Speroni E, Cervellati R, Piva G, Prandini A, et al. Carnosic acid from rosemary extracts: a potential chemoprotective agent against aflatoxin B1. An in vitro study. J Appl Toxicol 2007; 27:152-9.[CrossRef] [PubMed]
8. Gachkar L, Yadegari D, Rezaei MB, Taghizadeh M, Astaneh SA, Rasooli I. Chemical and biological characteristics of Cuminum Cyminum and Rosmarinus officinalis essential oils. Food Chem 2007;102:898-904.[CrossRef] [FullText]
9. Vigan M. Essential oils: renewal of interest and toxicity. Eur J Dermatol 2010;20:685-92. [PubMed]
10. Cavanagh HM, Wilkinson JM. Biological activities of Lavender essential oil. Phytother Res 2002;16:301-8.[CrossRef] [PubMed]
11. Carvalho RN Jr, Moura LS, Rosa PTV, Meireles MAM. Supercritical fluid extraction from rosemary (Rosmarinus officinalis): Kinetic data, extract’s global yield, composition, and antioxidant activity. J Supercrit Fluids 2005;35:197-204.
12. Ramìrez P, Garcìa-Risco MR, Santoyo S, Senoràns FJ, Ibànez E, Reglero G. Isolation of functional ingredients from rosemary by preparative-supecritical fluid chromatography (Prep-SFC). J Pharm Biomed Anal 2006;41:1606-13.[CrossRef] [PubMed]
13. Kruger H. Characterisation of chamomile volatiles by simultaneous distillation solid-phase extraction in comparison to hydrodistillation and simultaneous distillation extraction. Planta Medica 2010;76:843-6.[CrossRef] [PubMed]
14. Repcak M, Imrich J, Garcar, J. Quantitative evaluation of the main sesquiterpenes and polyacetilenes of Chamomolla recutita essential oil by high-performance liquid chromatography. Phytochem Anal 1999;10:335-8.[CrossRef]
15. Le Claire E, Schwaiger S, Banaigs B, Stuppner H, Garfner, F. Distribution of a new rosmarinic acid derivative in Eryngium alpinum L. and other Apiaceae. J Agric Food Chem 2005;53:4367-72.[CrossRef] [PubMed]
16. Zhang Z, Li S, Ownby S, Wang P, Yuan W, Zhang W, et al. Phenolic compounds and rare polyhydroxylated triterpenoid saponins from Eryngium yuccifolium. Phytochemistry 2008;69:2070-80.[CrossRef] [PubMed]
17. Karasova G, Lehotay J. Comparison of several extraction methods for the isolation of benzoic acid derivatives from Melissa officinalis. J Liq Chromatogr Relat Technol 2006;29:1633-44.[CrossRef]
18. Fecka I, Turek S. Determination of water-soluble polyphenolic compounds in commercial herbal teas from Lamiaceae: Peppermint, Melissa, and Sage. J Agric Food Chem 2007;55: 10908-17.[CrossRef] [PubMed]
19. Flamini G, Cioni PL, Morelli I, Macchia M, Ceccarini L. Main Agronomic-Productive Characteristics of two Ecotypes of Rosmarinus officinalis L. and Chemical Composition of Their Essential Oils. J Agric Food Chem 2002;50:3512-7.[CrossRef] [PubMed]
20. Quinn BP, Bernier UR, Booth MM. Identification of compounds from Etonia rosemary (Conradina etonia). J Chromatogr A 2007;1160:306-10.[CrossRef] [PubMed]
21. Palá-Paúl J, Copeland LM, Brophy JJ, Goldsack RJ. Essential oil composition of Eryngium rosolatum P.W. Michael ined.: a new undescribed species from eastern Australia. Biochem Syst Ecol 2006;34:796-801.[CrossRef]
22. Xiao C, Dai H, Liu H, Wang Y, Tang T. Revealing the metabonomic variation of rosemary extract using H NMR spectroscopy and multivariate data analysis. J Agric Food Chem 2008;56:10142-53.[CrossRef] [PubMed]
23. Boschi F, Nicolato E, Benati D, Marzola P, Sbarbati A. Drug targeting of airway surface liquid: a pharmacological MRI approach. Biomed Pharmacother 2008;62:410-9. [CrossRef] [PubMed]
24. Nicolato E, Boschi F, Marzola P, Sbarbati A. Secretory response induced by essential oils on airway surface liquid: a pharmacological MRI study. J Ethnopharmacol 2009;124:630-4.[CrossRef] [PubMed]
25. Tuchin V. Tissue Optics: Light Scattering Methods and Instrument for Medical Diagnosis. 2nd ed. 2007, SPIE Press, Washington DC, USA.
26. Stokes GG. On the Change of Refrangibility of Light. Phil. Trans. R. Soc. Lond. 1852;142:463-562.[CrossRef]
27. Holsa J. Persistent Luminescence Beats the Afterglow: 400 years of Persistent Luminescence. The Electrochemical Society Interface [Internet]. 2009. Available from: http://www.electrochem.org/dl/interface/wtr/wtr09/wtr09_p042-045.pdf
28. Havaux M, Triantaphylidès C, Genty B. Autoluminescence imaging: a non-invasive tool for mapping axidative stress. Trends Plant Sci 2006;11:480-4.[CrossRef] [PubMed]
29. Flors C, Fryer MJ, Waring J, Reeder B, Bechtold U, Mullineaux PM, et al. Imaging the production of singlet oxygen in vivo using a new fluorescent sensor, Singlet Oxygen sensor Green. J Exp Botany 2006;57:1725-34. [CrossRef] [PubMed]
30. Zhang L, Xing D, Wang J, Li L. Rapid and non-invasive detection of plants senescence using a delayed fluorescence technique. Photochem Photobiol Sci 2007;6:635-41.[CrossRef] [PubMed]
31. Pedrós R, Moya I, Goulas Y, Jacquemoud S. Chlorophyll fluorescence emission spectrum inside a leaf. Photochem Photobiol Sci 2008;7:498-502. [CrossRef] [PubMed]
32. Green-Hernandez C, Singleton JK, Aronzon DZ. Primary care pediatrics. 2001, Lippincott Williams & Wilkins, Philadelphia, PA, USA.
33. Troy T, Jekic-McMullen D, Sambucetti L, Rice B. Quantitative comparison of the sensitivity of detection of fluorescent and bioluminescent reporters in animal models. Mol Imaging 2004;3:9-23. [PubMed]
34. Skoog DA, Leary JL. Principles of Instrumental Analysis. 4th ed. 1992, Saunders College Publ., Orlando, FL, USA.
35. Umezu T, Nagano K, Ito H, Kosakai K, Sakaniwa M, Morita M. Anticonflict effects of lavender oil and identification of its active constituents. Pharmacol Biochem Behav 2006; 85:713-21.[CrossRef] [PubMed]
36. Fakhari AR, Salehi P, Heydari R, Ebrahimi SN, Haddad PR. Hydrodistillation-headspace solvent microextraction, a new method for analysis of the essential oil components of Lavandula angustifolia Mill. J Chromatogr A 2005;1098:14-8. [CrossRef] [PubMed]
[TOP]