V. Giansanti,1 G. Santamaria,1,2 A. Torriglia,3 F. Aredia,1 A.I. Scovassi,1 G. Bottiroli,1,2 A.C. Croce1,2
1Istituto di Genetica Molecolare del CNR, Pavia, Italy; 2Dipartimento di Biologia e Biotecnologie, Università di Pavia, Italy; 3INSERM U872, Centre de Recherches Biomédicales des Cordeliers, Paris, France
Correspondence: Anna Cleta Croce, IGM-CNR, Sezione Istochimica e Citometria, Dipartimento di Biologia Animale, Università di Pavia, Palazzo Botta 2, via A. Ferrata 9, 27100 Pavia, Italy.
Tel. +39.0382.986428 - Fax: +39.0382.986430.
E-mail: croce@igm.cnr.it
Key words: ARPE19 cells, autofluorescence, HMA, intracellular pH, fluorochrome, spectroscopy, imaging.
Contributions: VG, AIS, GB, ACC, study conception and design; VG, GS, FA, ACC, experiments, data acquisition and analysis; AIS, GB, ACC, drafting the manuscript; AT, critical discussion and text revision. All authors approved the final version of the manuscript.
Acknowledgements: GV was supported by an Investigator Fellowship from Collegio Ghislieri, Pavia, Italy.
Conflict of interest: the authors report no conflicts of interest.
Received for publication: 24 October 2011.
Accepted for publication: 24 November 2011.
©Copyright V. Giansanti et al., 2012
Licensee PAGEPress, Italy
European Journal of Histochemistry 2012; 56:e3
doi:10.4081/ejh.2012.e3
AbstractHMA (5-(N,N-hexamethylene)amiloride), which belongs to a family of novel amiloride derivatives, is one of the most effective inhibitors of Na+/H+ exchangers, while uneffective against Na+ channels and Na+/Ca2+ exchangers. In this study, we provided evidence that HMA can act as a fluorescent probe. In fact, human retinal ARPE19 cells incubated with HMA show an intense bluish fluorescence in the cytoplasm when observed at microscope under conventional UV-excitation conditions. Interestingly, a prolonged observation under continuous exposure to excitation lightdoes not induce great changes in cells incubated with HMA for times up to about 5 min, while an unexpected rapid increase in fluorescence signal is observed in cells incubated for longer times. The latter phenomenon is particularly evident in the perinuclear region and in discrete spots in the cytoplasm. Since HMA modulates intracellular acidity, the dependence of its fluorescence properties on medium pH and response upon irradiation have been investigated in solution, at pH 5.0 and pH 7.2. The changes in both spectral shape and amplitude emission indicate a marked pH influence on HMA fluorescence properties, making HMA exploitable as a self biomarker of pH alterations in cell studies, in the absence of perturbations induced by the administration of other exogenous dyes. |
Na+/H+ exchangers (NHEs) are a class of membrane proteins involved in cellular pH control. During the past decades, several compounds belonging to the amiloride family have been developed as inhibitors of these membrane exchangers, for both basic research and pharmacological application purposes. The first NHE inhibitor discovered, amiloride, is capable to inhibit different isoforms of NHE membrane proteins, but it is active also against Na+ channels and Na+/Ca2+exchangers.1 Thereafter, several amiloride derivatives have been developed, the most active being obtained by a double substitution on 5-amino group, leading to the production of DMA, EIPA, MIBA and HMA. Among these novel derivatives, HMA (5-(N,N-hexamethylene)amilo-ride) is one of the most active, being much more effective in inhibiting NHEs, while uneffective against Na+ channels and Na+/Ca2+ exchangers.1
Several groups have so far described the biological effects of HMA focusing on its ability to induce cell death in cancer cells. In this respect, it has been demonstrated that HMA administration to cell cultures results in an intra-cytosolic acidification and, possibly, activates cell death through the apoptotic pathway.2,3,4 Remarkably, Bourge et al.5 recently demonstrated that the pro-apoptotic effects of HMA may be triggered also by an indirect death stimulus involving a cytosolic Ca2+ concentration increase. These observations are in line with the results provided by Park et al.6 who described that HMA triggers apoptosis by depleting the endoplasmic reticulum Ca2+ store.
In this study, we provide evidence that HMA gives rise to fluorescence emission. In general, molecules acting as fluorophores can be exploited for qualitative and quantitative studies at cellular level.7 With regard to pharmacologically active molecules, their ability to give rise to intrinsic fluorescence emission can be a powerful tool to directly investigate their presence and interaction with cells and tissues, as to pharmacokinetics, drug subcellular influx, localization and redistribution, pharmacological action and its dependence on defined cellular biological features. Although these kinds of investigations concern mainly photosensitizers, which are molecules typically expected to exhibit intrinsic fluorescence emission upon suitable excitation,8,9,10,11,12,13 similar studies have been reported also for other classes of drugs.14,15,16,17,18 In the case of HMA, despite the evidence so far collected on its biological effects likely leading to cell death, to our knowledge no data are reported in the literature about the ability of this compound to give rise to fluorescence emission. The aim of this work is thus to characterize HMA fluorescence properties in cultured human ARPE19 cells and in solution, to provide a basis for an in situ, direct investigation of the biological effects of this compound.
HMA (Sigma-Aldrich, Milan, Italy) was diluted directly from the stock solution (80 mM, in DMSO) in phosphate buffer (0.1 M, pH 5.0-7.2) or in serum free cell culture medium to the final concentrations of 80 µM or 40 µM, respectively.
Human adult retinal pigmented epithelium -19 cells (ARPE19) were grown as monolayer at 37°C in humidified atmosphere containing 5% CO2 in D-MEM/F12 (1:1) medium supplemented with 10% FCS, 4 mM glutamine, 100 U/mL penicillin and 0.1 mg/mL streptomycin (all reagents from Celbio, Milan, Italy). Cells were seeded onto glass coverslips (22-mm diameter) in six-well multiplates at the density of 5x10⁴ cells/well, 48 h before HMA administration (40 mM; incubation times ranging from 2 min to 24 h). At the end of each incubation time, the coverslips were removed from the medium, rinsed twice with PBS, placed upside down on a 40 µL chamber (Hellma, Milan, Italy), mounted on a quartz microscopic slide and filled with fresh serum free culture medium, to be submitted to imaging or microspectrofluorometric analysis. Cell viability after irradiation was verified by means of Trypan blue (Sigma-Aldrich; 0.4% in cell medium) exclusion test.
Microspectrofluorimetric analysis was performed in epiillumination by means of a microspectrograph (Leitz, Wetzlar, Germany) equipped with an Optical Multichannel Analyzer (EG&G-PAR, Princeton, USA) with a 512-element intensified diode array detector (mod. 1420/512). Excitation light was provided by a 100 W Hg lamp as excitation source. The measurement conditions were: 366 nm band-pass interference excitation filter (HBW 10 nm, T%366=30) associated with the anti-thermic filters KG1, BG38 to select the excitation light; TK 390 dichroic mirror, 380 barrier filter, to select emission light, collected in the 400-650 nm spectral region. Microspectrofluori-metric analysis was performed on the HMA solutions placed in a 40 µL chamber mounted on a quartz microscopic slide (Hellma, Milan, Italy) and covered with a coverslip, by means of a 25x Leitz objective (NA 0.60). Single cell measurements were performed through the Leitz microspectrograph by means of a 100x Leitz oil objective with an incorporated iris diaphragm (NA 0.60-1.32). To avoid unwanted photobleaching and/or photoactive effects all operations were performed under low environmental light, and the areas to be measured were selected and focused at microscope under low bright field illumination. Acquisition of each spectrum lasted 2 sec (10 sequential scans of 200 milli-sec each). Spectra were acquired at time 0 and after 20 sec of continuous irradiation (light fluence rate=6.35 mW cm-2 at the focal plane, for a total final dose of 127.00 mJ cm-2). Solutions were irradiated by exposing them to the light rising from the 100 W Hg lamp, and selected by the above described 366 nm band-pass interference, KG1, and BG38 filters, combined with neutral filters to obtain a light dose at the front of the quartz cuvette comparable to that applied for microspectrofluorometry. Spectra were processed with the Savitzky-Golay algorithm option of the PeakFitTM program (Systat Software Inc., London, UK), with the 10% level to smooth the noisy data.
Fluorescence images were acquired by means of an Olympus BX51 fluorescence microscope (Olympus Optical Co. GmBH, Hamburg, Germany) equipped with a 100 W Hg excitation lamp and a 4.1 Mpixel digital photocamera (Olympus Camedia C-4040 zoom), operating under fixed aperture value and acquisition time conditions (F=2.6, 1/8 sec). Images were acquired by means of a WU Olympus fluorescence cube (330-385 nm band-pass excitation filter), FWHM 58 nm, BA420 long-pass barrier filter, named UV conditions. Images were acquired under the same irradiation conditions used for microspectrofluorometric analysis. Fluorescence images were collected using a 40x Olympus UplanFl objective (NA 0.75).
A Quinine Sulphate solution (1 µM, in 1 N H2SO4, placed in a 40 µL Hellma chamber) was used as a reference standard for fluorescence intensity-based measurement.
Experiments were performed in triplicate, and at least 40 cells were analyzed for each condition, for both spectral and imaging analysis.
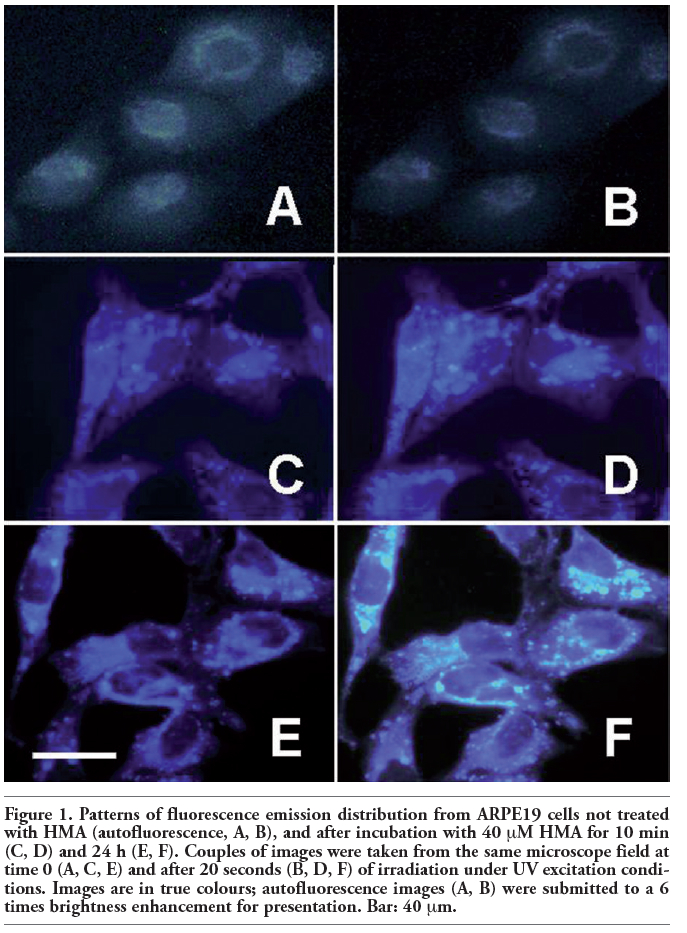
Human ARPE19 cells observed at microscope under UV excitation conditions in the absence of any drug incubation revealed an autofluorescence pattern consisting in a faint, light bluish emission, mainly located in the cytoplasm, surrounding or overlying the nuclei (Figure 1A). Continuous irradiation induced a decrease of the autofluorescence emission (Figure 1B). HMA incubation resulted in the presence of a blue fluorescence in the cytoplasm, with a prevailing emission signal localized in the perinuclear polar regions and in some distinct spots of the cytoplasm, surrounding the nuclei characterized by a weaker and darker blue emission. Comparable subcellular fluorescence distribution patterns were observed in cells submitted to HMA incubation for times ranging from few minutes to 24 h (Figure 1 C-F). Interestingly, a prolonged observation of the same microscopic field resulted in different effects that appeared to be dependent on the incubation time; no great changes occurred in the case of cells incubated for times shorter than 1 h (Figure 1 C,D), while an unexpected, marked increase of the fluorescence emission was observed in cells incubated with HMA for longer times (Figure 1 E,F). This rising of the fluorescence signal was particularly evident in the perinuclear region, and in numerous distinct spots, becoming much brighter than the surrounding cytoplasm (Figure 1 F). Of note, the effects on HMA emission properties ascribable to the continuous irradiation with the excitation light were induced under microscope conventional observation conditions. No appreciable morphological changes indicating cell integrity alteration were observed in the cells at the end of irradiation, consistently with the absence of staining following the Trypan blue exclusion test.
The fluorescence emission in HMA treated cells and possible changes induced by UV irradiation were furtherly characterized by means of microspectrofluorometry. The fluorescence spectra recorded from single living ARPE19 cells not treated with HMA, i.e. autofluorescence, or following the drug administration showed an emission band in the 420-480 nm region. The signal amplitude was much lower in the case of autofluorescence than for HMA treated cells (Figure 2A). These latter showed a rising of the emission signal in dependence of the incubation time, while only small changes affected the spectral shape, in terms of a slight narrowing toward the blue region (Figure 2B).
The response to irradiation was strongly affected by HMA incubation time. Within few min of HMA administration, continuous irradiation of the same cellular area resulted in a red shift of the spectral profile (Figure 3A), which was accompanied by a slight rising in the fluorescence emission intensity. For longer incubation times (from 1 h to 24 h), irradiation affected in particular the fluorescence emission intensity, undergoing a marked increase, up to 70%, between measurements at times 0 and 20 sec of irradiation (Figure 3B).
Taking into account that the biological effects of HMA are mediated by its ability to modulate intracellular acidity,4 the fluorescence properties of this compound were investigated in solution, under defined pH conditions. HMA fluorescence features were monitored in phosphate buffer solution in terms of spectral shape, emission amplitude and changes during irradiation.
Fluorescence spectra recorded from HMA solution showed a main emission band in the blue region, peaking at about 430 nm at pH 7.2, and at 425 nm at pH 5.0. Irradiation induced a shift and a widening towards longer wavelengths of the emission band, which was accompanied by an increase in the emission values. The changes in the spectral shape were favoured by pH 7.2 in comparison with pH 5.0 (Figure 4 A,B). On the contrary, the emission amplitude was favoured at pH 5.0, being about 40% higher than that exhibited by HMA at pH 7.2 already at time 0, and showing an increase by about 90% following 6 min of irradiation in comparison with the increase of about 10% at pH 7.2.
|
Figure 1. Patterns of fluorescence emission distribution from ARPE19 cells not treated with HMA (autofluorescence, A, B), and after incubation with 40 mM HMA for 10 min (C, D) and 24 h (E, F). Couples of images were taken from the same microscope field at time 0 (A, C, E) and after 20 seconds (B, D, F) of irradiation under UV excitation conditions. Images are in true colours; autofluorescence images (A, B) were submitted to a 6 times brightness enhancement for presentation. Bar: 40 mm. |
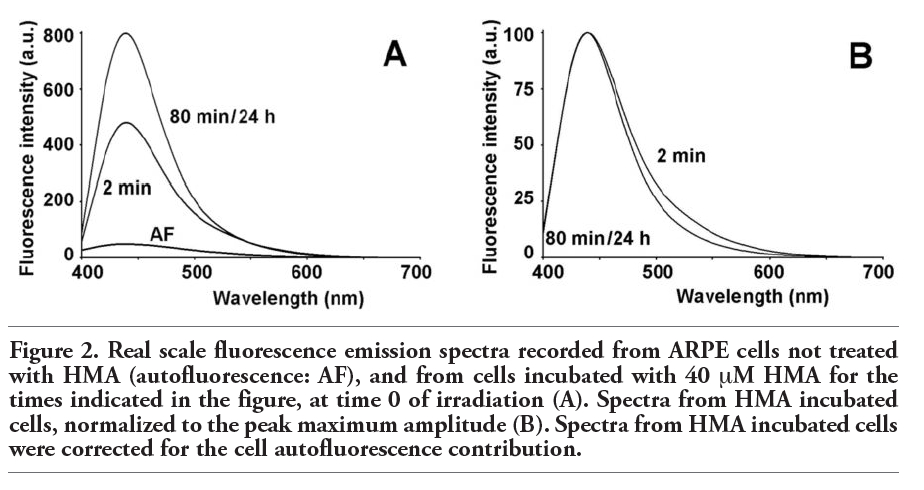 |
Figure 2. Real scale fluorescence emission spectra recorded from ARPE cells not treated with HMA (autofluorescence: AF), and from cells incubated with 40 mM HMA for the times indicated in the figure, at time 0 of irradiation (A). Spectra from HMA incubated cells, normalized to the peak maximum amplitude (B). Spectra from HMA incubated cells were corrected for the cell autofluorescence contribution. |
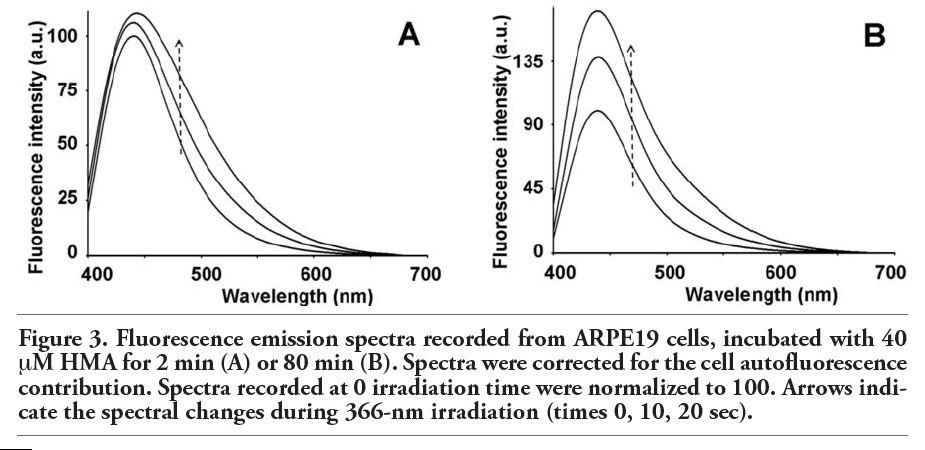 |
Figure 3. Fluorescence emission spectra recorded from ARPE19 cells, incubated with 40 mM HMA for 2 min (A) or 80 min (B). Spectra were corrected for the cell autofluorescence contribution. Spectra recorded at 0 irradiation time were normalized to 100. Arrows indicate the spectral changes during 366-nm irradiation (times 0, 10, 20 sec). |
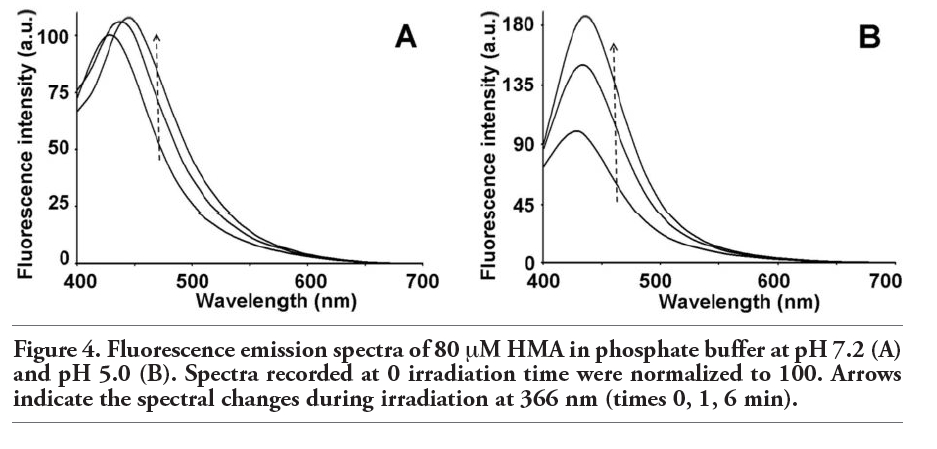 |
Figure 4. Fluorescence emission spectra of 80 mM HMA in phosphate buffer at pH 7.2 (A) and pH 5.0 (B). Spectra recorded at 0 irradiation time were normalized to 100. Arrows indicate the spectral changes during irradiation at 366 nm (times 0, 1, 6 min). |
The data obtained in solution confirm the noticeable influence of pH conditions on HMA fluorescence response to irradiation. On this basis, HMA can be considered as a self biomarker, exploitable to detect directly its intracellular effects, in the absence of perturbations from other pH sensitive dyes. Although a cautionary note should be required when investigating different organelles in HMA treated cells by means of specific fluorescent vital-cell dyes, to avoid overimposition of emission spectra, interesting perspectives are opened, especially in exploring at subcellular level the mechanisms underlying, or regulated by, intracellular pH control in cells with particular biological properties, e.g. cancer cells, which are characterized by an extracellular acidification.19
1. Masereel B, Pochet L, Laeckmann D. An overview of inhibitors of Na(+)/H(+) exchanger. Eur J Med Chem 2007;38:547-54. [CrossRef][PubMed]
2. Rich IN, Worthington-White D, Garden OA, Musk P. Apoptosis of leukemic cells accompanies reduction in intracellular pH after targeted inhibition of the Na(+)/H(+) exchanger. Blood 2000;95:1427-34.[PubMed]
3. Coakley RJ, Taggart C, McElvaney NG, O'Neill SJ. Cytosolic pH and the inflammatory microenvironment modulate cell death in human neutrophils after phagocytosis. Blood 2002;100:3383-91. [CrossRef][PubMed]
4. Altairac S, Zeggai S, Perani P, Courtois, Torriglia A. Apoptosis induced by Na+/H+ antiport inhibition activates the LEI/L-DNase II pathway. Cell Death Differ 2003; 10:548-57. [CrossRef][PubMed]
5. Bourge M, Tlili A, Dupré-Crochet S, Nüsse O, Sulpice JC. Amiloride derivatives modulate PS externalization in neutrophil-like PLB-985 cells. Biochem Pharmacol 2010; 80:1012-20. [CrossRef][PubMed]
6. Park KS, Poburko D, Wollheim CB, Demaurex N. Amiloride derivatives induce apoptosis by depleting ER Ca(2+) stores in vascular endothelial cells. Br J Pharmacol 2009;156:1296-304. [CrossRef][PubMed]
7. Haugland RP, Spence MTZ, Johnson ID, Basey A. The handbook: a guide to fluorescent probes and labeling technologies, 10th ed. Firefly, Eugene, OR, USA, 2005.
8. Miller GG, Brown K, Moore RB, Diwu ZJ, Liu J, Huang L, et al. Uptake kinetics and intracellular localization of hypocrellin photosensitizers for photodynamic therapy: a confocal microscopy study. Photo-chem Photobiol 1995;61:632-8. [CrossRef][PubMed]
9. Croce AC, Supino R, Lanza KS, Locatelli D, Baglioni P, Bottiroli G. Photosensitizer accumulation in spontaneous multidrug resistant cells: a comparative study with Rhodamine 123, Rose Bengal acetate and Photofrin. Photochem Photobiol Sci 2002; 1;71-8. [CrossRef][PubMed]
10. Berg K, Selbo PK, Weyergang A, Dietze A, Prasmickaite L, Bonsted A, et al. Porphyrin -related photosensitizers for cancer imaging and therapeutic applications. J Microsc 2005;218:133-47. [CrossRef][PubMed]
11. Wang X, Wang P, Tong W, Liu Q. Compa-rison of pharmacokinetics, intracellular localizations and sonodynamic efficacy of endogenous and exogenous protoporphyrin IX in sarcoma 180 cells. Ultrasonics 2010;50:3-10. [CrossRef][PubMed]
12. Barnes LD, Giuliano EA, Ota J. Cellular localization of Visudyne as a function of time after local injection in an in vivo model of squamous cell carcinoma: an investigation into tumor cell death. Vet Ophthalmol 2010;13:158-65. [CrossRef][PubMed]
13. Croce AC, Fasani E, Bottone MG, De Simone U, Santin G, Pellicciari C, Bottiroli G. Hypocrellin-B acetate as a fluorogenic substrate for enzyme-assisted cell photosensitization. Photochem Photobiol Sci 2011;10:1783-90. [CrossRef][PubMed]
14. Feofanov A, Sharonov S, Fleury F, Kudelina I, Nabiev I. Quantitative confocal spectral imaging analysis of mitoxantrone within living K562 cells: intracellular accumulation and distribution of monomers, aggregates, naphtoquinoxaline metabolite, and drug-target complexes. Biophys J 1997;73: 3328-36. [CrossRef]
15. Pasqua G, Monacelli B, Valletta A. Cellular localisation of the anti-cancer drug camptothecin in Camptotheca acuminata Decne (Nyssaceae). Eur J Histochem 2004;48:321-7. [PubMed]
16. Supino R, Scovassi AI, Croce AC, Dal Bo L, Favini E, Corbelli A, et al. Biological effects of a new vacuolar-H,-ATPase inhibitor in colon carcinoma cell lines. Ann NY Acad Sci 2009;1171:606-16. [CrossRef][PubMed]
17. Croce AC, Bottiroli G, Supino R, Favini E, Zuco V, Zunino F. Subcellular localization of the camptothecin analogues, topotecan and gimatecan. Biochem Pharmacol 2004; 67:1035-45. [CrossRef][PubMed]
18. Butts CA, Xi J, Brannigan G, Saad AA, Venkatachalan SP, Pearce RA, et al. Identification of a fluorescent general anesthetic, 1-aminoanthracene. Proc Natl Acad Sci USA 2009;106:6501-6. [PubMed]
19. McCarty MF, Whitaker J. 2010. Manipulating tumor acidification as a cancer treatment strategy. Altern Med Rev 2010; 15:264-72.[PubMed]
[TOP]